Last week, I virtually attended the Knowledge Graph Conference 2020. Originally, KGC was planned to be hosted in New York at Columbia University but, as with everything, had to go online because of the pandemic.

Before getting to the content, I wanted to talk about logistics.  Kudos to Francois Scharffe and the team for putting this conference online quickly and running it so smoothly. Just thinking of all the small things – for example, as a speaker I was asked to do a dry run with the organizers and get comments back for how the presentation went on Zoom. The conference Slack workspace was booming with tons of different challenges. The organizers had a nice cadence of talk announcements while boosting conversation by pushing the Q/A session onto Slack. This meant that the conversations could continue beyond each individual session. At the meta level, they managed to get the intensity of a conference online through the amount of effort in curating those Slack channels along with the rapid fire pace of the talks over the two main track days. Personally, I somehow found this more tiring than F2F because somehow Zoom presentations require full focus to ingest. Additionally, there’s this temptation to do both the conference and your normal workday when the event is in another time zone….which… err.. I might have been guilty of. I also did have some hallway conversations on Slack but not as much as I normally would in a F2F setting.

But what’s the conference about? KGC started last year with the idea of having an application and business oriented event focused on knowledge graphs. I would summarize  the aim is to bring people together to talk about knowledge graph technology in action, see the newest commercially ready tech and get a glimpse of future tech. The conference has the same flavor of Connected Data London . As a researcher, I really enjoy seeing the impact these technologies are having in a myriad of domains.

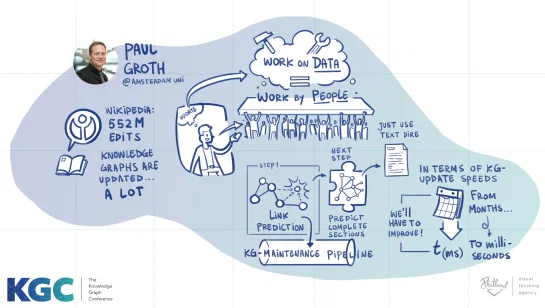
So what was I doing there? I was talking about Knowledge Graph Maintenance (slides) – how do we integrate machine learning techniques and the work of people to not only create but maintain knowledge graphs. Here’s my talk summarized in one picture:
EXp_fpiWAAAs9GC.jpeg

My goal is to get  organizations who are adopting knowledge graphs to think not only about one-of creation but think about what goes in to keeping that knowledge up-to-date. I also wanted to give a sketch of the current research we’ve been doing in this direction.

There was a lot of content at this event (which will be available online) so I’ll just call out three things I took away from it.

Human Understandable Data

One of the themes that kept coming up was the use of knowledge graphs to help the data in an organization match the conceptualizations that are used within businesses. Sure we can do this by saying we need to build an ontology or logical model or a semantic dictionary but the fundamental point that was highlighted again and again is that this data-to-business bridge was the purpose of building many knowledge graphs. It was kind of summed up in the following two slides from Michael Grove:

cim.png  logicalmodel.png

This also came through in Ora Lassila’s talk (now at Amazon Neptune) as well as the the tutorial I attended by Juan Sequeda about building Enterprise Knowledge Graphs from Relational Databases. Juan ran through a litany of mapping patterns all trying to bridge from data stored for specific applications to human understandable data. I’m looking forward to seeing this tutorial material available.

The Knowledge Scientist 

Given the need to bridge the gap between application data and business level goals, new kinds of knowledge engineering and tools to facilitate that we’re also of interest. Why aren’t existing approaches enough? I think the assumption is that there’s a ton of data that people doing this activity need to deal with.  Both Juan and I discussed the need to recognize these sorts of people – which we call a Knowledge Scientist– and it seemed to resonate or at least the premise behind the term did.

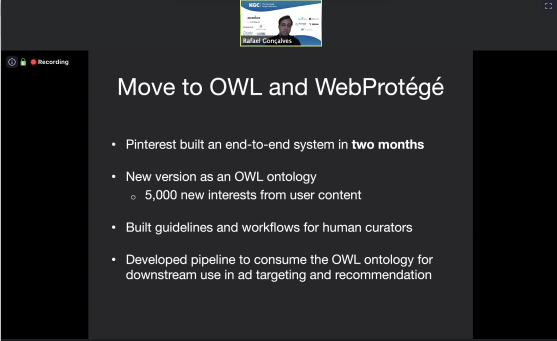
An excellent example of supporting this sort of tools to support knowledge engineering was by Rafael Gonçalves on how Pinterest used WebProtege to update and manage their taxonomy (paper):
pinintereest.png

Likewise, Bryon Jacob discussed about how the first step to getting to a knowledge graph was through the better cataloging of data within the organization. It reminds me of the lesson we learned from linked data – that before we can have knowledge we need to index and catalog the underlying data.  Also, I can never overlook a talk that gives a shoutout to PROV and the need for lineage and provenance 🙂 .

Knowledge Graphs as Data Assets

I really enjoyed seeing all the various kinds of application areas using knowledge graphs. There were early domain adopters  for example in drug discovery and scholarly data that have pushed further in using this technology:

But also new domains like personal health (e.g. deck from Jim Hendler).

The two I liked the most were on law and real estate.  David Kamien fromMind Alliance talked about how knowledge graphs in combination with NLP can specifically help law firms for example by automatically suggesting new business development opportunities by analyzing court dockets.

Ron Bekkerman‘s talk on the real estate knowledge graph that they’ve constructed at Cherre was the most eye opening to me. Technically, it was cool in that are applying geometric deep learning to perform entity resolution to build a massive graph of real estate. I had been at another academic workshop on this only a ~2 weeks prior. But from a business sense, their fundamental asset is that the cleaned data in the form of a knowledge graph. It’s not just data but reliable connected data. Really one to watch.

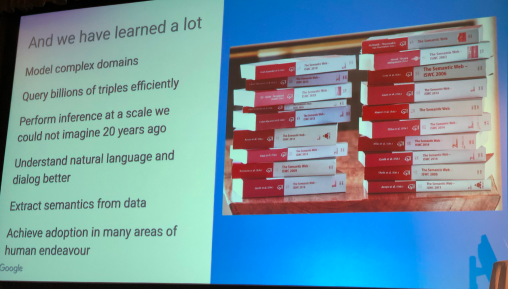
To wrap-up, the intellectual history of knowledge graphs is long (ee John Sowa’s slides and knowledgegraph.today) but I think it’s nice to see that we are at stage where this technology is being deployed at scale in practice, which brings additional research challenges for folks like me.

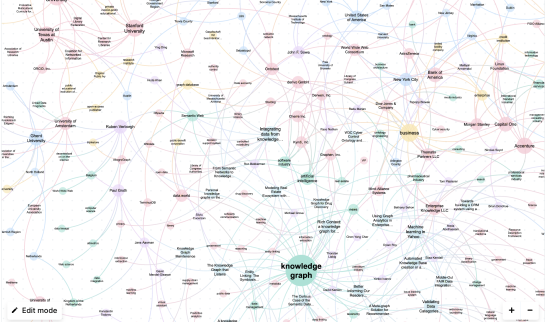
Part of the Knowledge Graph of the Knowledge Graph Conference:
kgc.png

Random Notes


It’s not so frequently that you get a major international conference in your area of interest around the corner from your house. Luckily for me, that just happened. From June 30th – July 5th, SIGMOD/PODS was hosted here in Amsterdam. SIGMOD/PODS is one of the major conferences on databases and data management. Before diving into the event itself, I really wanted to thank  Peter Boncz, Stefan Manegold, Hannes Mühleisen and the whole organizing team (from @CWI_DA and the NL DB community) for getting this massive conference here:

and pulling off things like this:

Oh and really nice badges too:BKBnl49c.jpgGood job!

Sl1lfSTB.jpeg

Surprisingly, this was the first time I’ve been at SIGMOD. While I’m pretty acquainted with the database literature, I’ve always just hung out in different spots. Hence, I had some trepidation attending wondering if I’d fit in? Who would I talk to over coffee? Would all the papers be about join algorithms or implications of cache misses on some new tree data structure variant? Now obviously this is all pretty bogus thinking, just looking at the proceedings would tell you that. But there’s nothing like attending in person to bust preconceived notions. Yes, there were papers on hardware performance and join algorithms – which were by the way pretty interesting – but there were many papers on other data management problems many of which we are trying to tackle (e.g. provenance, messy data integration).  Also, there were many colleagues that I knew (e.g. Olaf & Jeff above). Anyway, perceptions busted! Sorry DB friends you might have to put up with me some more 😀.

I was at the conference for the better part of 6 days – that’s a lot of material – so I definitely missed a lot but here are the four themes I took from the conference.

  1. Data management for machine learning
  2. Machine learning for data management
  3. New applications of provenance
  4. Software & The Data Center Computer

Data Management for Machine Learning

iU1GfnUz.jpeg

Matei Zaharia (Stanford/Databricks) on the need for data management for ML

The success of machine learning has rightly changed computer science as a field. In particular, the data management community writ large has reacted trying to tackle the needs of machine learning practitioners with data management systems. This was a major theme at SIGMOD.

There were a number of what I would term holistic systems that helped manage and improve the process of building ML pipelines including using data. Snorkel DryBell provides a holistic system that lets engineers employ external knowledge (knowledge graphs, dictionaries, rules) to reduce the number of needed training examples needed to create new classifiers. Vizier provides a notebook data science environment backed fully by a provenance data management environment that allows data science pipelines to be debugged and reused.  Apple presented their in-house system for helping data management specifically designed for machine learning – from my understanding all their data is completely provenance enabled – ensuring that ML engineers know exactly what data they can use for what kinds of model building tasks.

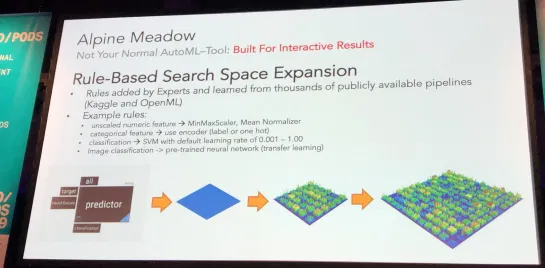
I think the other thread here is the use of real world datasets to drive these systems. The example that I found the most compelling was Alpine Meadow++ to use knowledge about ML datasets (e.g. Kaggle) to improve the suggestion on new ML pipelines in an AutoML setting. rsfZ2iZO.jpeg

On a similar note, I thought the work of Suhail Rehman from the University of Chicago on using over 1 million juypter  notebooks to understand data analysis workflows was particularly interesting. In general, the notion is that we need to taking a looking at the whole model building and analysis problem in a holistic sense inclusive of data management . This was emphasized by the folks doing the Magellan entity matching project in their paper on Entity Matching Meets Data Science.

9On2RADL.jpeg

Machine Learning for Data Management

On the flip side, machine learning is rapidly influencing data management itself. The aforementioned Megellan project has developed a deep learning entity matcher. Knowledge graph construction and maintenance is heavily reliant on ML. (See also the new work from Luna Dong & colleagues which she talked about at SIGMOD). Likewise, ML is being used to detect data quality issues (e.g. HoloDetect).

ML is also impacting even lower levels of the data management stack.

xVcvdTX8.jpeg

Tim Kraska list of algorithms that are or are being MLified

I went to the tutorial on Learned Data-intensive systems from Stratos Idreos and Tim Kraska. They overviewed how machine learning could be used to replace parts or augment of the whole database system and when that might be useful.

KbYGVEA2.jpegIt was quite good, I hope they put the slides up somewhere. The key notion for me is this idea of instance optimality: by using machine learning we can tailor performance to specific users and applications whereas in the past this was not cost effective because the need for programmer effort. They suggested 4 ways to create instance optimized algorithms and data structures:

  1. Synthesize traditional algorithms using a model
  2. Use a CDF model of the data in your system to tailor the algorithm
  3. Use a prediction model as part of your algorithm
  4. Try to to learn the entire algorithm or data structure

They had quite the laundry list of recent papers tackling this approach and this seems like a super hot topic.

Another example was SkinnerDb which uses reinforcement learning to on the fly to learn optimal join ordering. I told you there were papers on joins that were interesting.

BBv8y0SZ.jpeg

New Provenance Applications

There was an entire session of SIGMOD devoted to provenance, which was cool.  What I liked about the papers was that that they had several new applications of provenance or optimizations for applications beyond auditing or debugging.

In addition to these new applications, I saw some nice new provenance capture systems:

Software & The Data Center Computer

This is less of a common theme but something that just struck me. Microsoft discussed their upgrade or overhaul of the database as a service that they offer in Azure. Likewise, Apple discussed FoundationDB – the mult-tenancy database that underlines CloudKit.

LI03R_uu.jpeg

JD.com discussed their new file system to deal with containers and ML workloads across clusters with tens of thousands of servers. These are not applications that are hosted in the cloud but instead they assume the data center. These applications are fundamentally designed with the idea that they will be executed on a big chunk of an entire data center. I know my friends at super computing have been doing this for ages but I always wonder how to change one’s mindset to think about building applications that big and not only building them but upgrading & maintaining them as well.

Wrap-up

Overall, this was a fantastic conference. Beyond the excellent technical content, from a personal point of view, it was really eye opening to marinate in the community. From the point of view of the Amsterdam tech community, it was exciting to have an Amsterdam Data Science Meetup with over 500 people.

If you weren’t there, video of much of the event is available.

Random Notes


From June 2 – 6, I had the pleasure of attending the Extended Semantic Web Conference 2019 held in Portorož, Solvenia. After ESWC, I had another semantic web visit with Axel Polleres, Sabrina Kirrane and team in Vienna. We had a great time avoiding the heat and talking about data search and other fun projects. I then paid the requisite price for all this travel and am just now getting down to emptying my notebook. Note to future self, do your trip reports at the end of the conference.

It’s been awhile since I’ve been at ESWC so it was nice to be back. The conference I think was down a bit in terms the number of attendees but the same community spirit and interesting content (check out the award winners) was there.  Shout out to Miriam Fernandez and the team for making it an invigorating event:

So what was I doing there. I was presenting work at the Deep Learning for Knowledge Graph workshop on trying to see if we could answer structured (e.g. SPARQL) queries over text (paper):

The workshop itself was packed. I think there were about 30-40 people in the room.  In addition to the presenting the workshop paper, I was also one of the mentors for the doctoral consortium. It was really nice to see the next up and coming students who put a lot of work into the session: a paper, a revised paper, a presentation and a poster. Victor and Maria-Esther did a fantastic job organizing this.

So what were my take-aways from the conference. I had many of the same thoughts coming out of this conference that I had when I was at the recent AKBC 2019 especially around the ideas of polyglot representation and scientific literature understanding as an important domain driver (e.g. a Predicting Entity Mentions in Scientific Literature and Mining Scholarly Data for Fine-Grained Knowledge Graph Construction. ) but there were some additional things as well.

Target Schemas

The first was a notion that I’ll term “target schemas”. Diana Maynard in her keynote talked about this. These are little conceptually focused ontologies designed specifically for the application domain. She talked about how working with domain experts to put together these little ontologies that could be the target for NLP tools was really a key part of building these domain specific analytical applications.   I think this notion of simple schemas is also readily apparent in many commercial knowledge graphs.

The notion of target schemas popped up again in an excellent talk by Katherine Thornton on the use of ShEx. In particular, I would call out the introduction of an EntitySchema part of Wikidata. (e.g. Schema for Human Gene or Software Title). These provide these little target schemas that say something to the effect of “Hey if you match this kind of schema, I can use them in my application”. I think this is a really powerful development.

The third keynote by Daniel Quercia was impressive. The Good City Life project about applying data to understand cities just makes you think. You really must check it out. More to this point of target schemas, however, was the use of these little conceptual descriptions in the various maps and analytics he did. By, for example, thinking about how to define urban sounds or feelings on a walking route, his team was able to develop these fantastic and useful views of the city.

I think the next step will be to automatically generate these target schemas. There was already some work headed into that direction. One was Generating Semantic Aspects for Queries , which was about how to use document mining to select which attributes for entities one should show for an entity. Think of it as selecting what should show up in a knowledge graph entity panel. Likewise, in the talk on Latent Relational Model for Relation Extraction, Gaetano Rossiello talked about how to think about using analogies between example entities to help extract these kind of schemas for small domains:

m97pj-zb.jpeg

I think this notion is worth exploring more.

Feral Spreadsheets

What more can I say:

We need more here. Things like MantisTable. Data wrangling is the problem. Talking to Daniel about the data behind his maps just confirmed this problem as well.

Knowledge Graph Engineering

This was a theme that was also at AKBC – the challenge of engineering knowledge graphs. As an example, the Knowledge Graph Building workshop was packed. I really enjoyed the discussion around how to evaluate the effectiveness of data mapping languages led by Ben de Meester especially with emphasis around developer usability. The experiences shared by the team from the industrial automation from Festo were really insightful. It’s amazing to see how knowledge graphs have been used to accelerate their product development process but also the engineering effort and challenges to get there.

GBVSKwXC

Likewise, Peter Haase in his audacious keynote (no slides – only a demo) showed how far we’ve come in the underlying platforms and technology to be able to create commercially useful knowledge graphs. This is really thanks to him and the other people who straddle the commercial/research line. It was neat to see the Open PHACTS style biomedical knowledge graph being built using SPARQL and api service wrappers:

V9RbjOo_.jpeg

However, still these kinds of wrappers need to be built, the links need to be created and more importantly the data needs to be made available. A summary of challenges:

Overall, I really enjoyed the conference. I got a chance to spend sometime with a bunch of members of the community and it’s exciting to see the continued excitement and the number of new research questions.

Random Notes


About two weeks ago, I had the pleasure of attending the 1st Conference on Automated Knowledge Base Construction held in Amherst, Massachusetts. This conference follows up on a number of successful workshops held at venues like NeurIPS and NAACL. Why a conference and not another workshop? The general chair and host of the conference (and he really did feel like a host), Andrew McCallum articulated this as coming from three drivers: 1) the community spans a number of different research areas but was getting its own identity; 2) the workshop was outgrowing typical colocation opportunities and 3) the motivation to have a smaller event where people could really connect in comparison to some larger venues.

I don’t know the exact total but I think there was just over 110 people at the conference. Importantly, there were top people in the field and they stuck around and hung out. The size, the location, the social events (a lovely group walk in the forest in MA), all made it so that the conference achieved the goal of having time to converse in depth. It reminded me a lot of our Provenance Week events in the scale and depth of conversation.

Oh and Amherst is a terribly cute college town:

2019-05-19 16.56.06.jpg

Given that the conference subject is really central to my research, I found it hard to boil down everything into a some themes but I’ll give it a shot:

  • Representational polyglotism
  • So many datasets so little time
  • The challenges of knowledge (graph) engineering
  • There’s lots more to do!

Representational polyglotism

Untitled 2.png

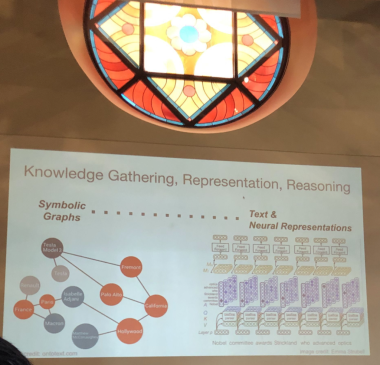
One of the main points that came up frequently both in talks and in conversation was around what one should use as representation language for knowledge bases and for what purpose. Typed graphs have clearly shown their worth over the last 10 years but with the rise of knowledge graphs in a wide variety of industries and applications. The power of the relational approach especially in its probabilistic form  was shown in excellent talks by Lise Getoor on PSL and by Guy van den Broeck. For efficient query answering and efficiency in data usage, symbolic solutions work well. On the other hand, the softness of embedding or even straight textual representations enables the kind of fuzziness that’s inherent in human knowledge. Currently, our approach to unify these two views is often to encode the relational representation in an embedding space, reason about it geometrically, and then through it back over the wall into symbolic/relational space.  This was something that came up frequently and Van den Broek took this head on in his talk.

Then there’s McCallum’s notion of text as a knowledge graph. This approach was used frequently to different degrees, which is to be expected given that much of the contents of KGs is provided through information extraction. In her talk, Laura Dietz, discussed her work where she annotated the edges of a knowledge graph with paragraph text to improve entity ranking in search.  Likewise, the work presented by Yejin Choi around common sense reasoning used natural language as the representational “formalism”. She discussed the ATOMIC (paper) knowledge graph  which represents a crowed sourced common sense knowledge as natural language text triples (e.g. PersonX finds ___ in the literature).  She then described transformer based, BERT-esque, architectures  (COMET: Commonsense Transformers for Knowledge Graph Construction) that perform well on common sense reasoning tasks based on these kinds of representations.

The performance of BERT style language models on all sorts of tasks, led to Sebastian Riedel considering whether one should treat these models as the KB:

IMG_0738.jpg

It turns out that out-of-the box BERT performs pretty well as a knowledge base for single tokens that have been seen frequently by the model. That’s pretty amazing. Is storing all our knowledge in the parameters of a model the way to go? Maybe not but surely it’s good to investigate the extent of the possibilities here. I guess I came away from the event thinking that we are moving toward an environment where KBs will maintain heterogenous representations and that we are at a point where we need to embrace this range of representations to produce results in order face the challenges of the fuzzy. For example, the challenge of reasoning:

or of disagreement around knowledge as discussed by Chris Welty:

wWPblo8e.jpeg

So many datasets so little time

Progress in this field is driven by data and there were a lot of new datasets presented at the conference. Here’s my (probably incomplete) list:

  • OPIEC – from the makers of the MINIE open ie system – 300 million open information extracted triples with a bunch of interesting annotations;
  • TREC CAR dataset – cool task, auto generate articles for a search query;
  • HAnDS – a new dataset for fined grained entity typing  to support thousands of types;
  • HellaSwag – a new dataset for common sense inference designed to be hard for state-of-the-art transformer based architectures (BERT);
  • ShARC – conversational question answering dataset focused on follow-up questions
  • Materials Synthesis annotated data for extraction of material synthesis recipes from text. Look up in their GitHub repo for more interesting stuff
  • MedMentions – annotated corpora of UMLs mentions in biomedical papers from CZI
  • A bunch of datasets that were submitted to EMNLP so expect those to come soon – follow @nlpmattg.

The challenges of knowledge (graph) engineering

Juan Sequeda has been on this topic for a while – large scale knowledge graphs are really difficult to engineer. The team at DiffBot – who were at the conference – are doing a great job of supplying this engineering as a service through their knowledge graph API.  I’ve been working with another start-up SeMI who are also trying to tackle this challenge. But this is still complicated task as underlined for me when talking to Francois Scharffe who organized the recent industry focused Knowledge Graph Conference. The complexity of KG (social-technical) engineering was one of the main themes of that conference. An example of the need to tackle this complexity at AKBC was the work presented about the knowledge engineering going on for the KG behind Apple’s Siri. Xiao Ling emphasized that they spent a lot of their time thinking about and implementing systems for knowledge base construction developer workflow:

Thinking about these sorts of challenges was also behind several of the presentations in  the Open Knowledge Network workshop: Vicki Tardif from the Google Knowledge Graph discussed these issues in particular with reference to the muddiness of knowledge representation (e.g. how to interpret facets of a single entity? or how to align the inconsistencies of people with that of machines?). Jim McCusker and Deborah McGuinness’ work on the provenance/nanopublication driven WhyIs framework for knowledge graph construction is an important in that their software views a knowledge graph not as an output but as a set of tooling for engineering that graph.

The best paper of the conference Alexandria: Unsupervised High-Precision Knowledge Base Construction using a Probabilistic Program was also about how to lower the barrier to defining knowledge base construction steps using a simple probabilistic program. Building a KB from a single seed fact is impressive but then you need the engineering effort to massively scale probabilistic inference.

Alexandra Meliou’s work on using provenance to help diagnose these pipelines was particularly relevant to this issue. I have now added a bunch of her papers to the queue.

There’s lots more to do

One of the things I most appreciated was that many speakers had a set of research challenges at the end of their presentations. So here’s a set of things you could work on in this space curated from the event. Note these may be paraphrased.

  • Laura Dietz:
    • General purpose schema with many types
    • High coverage/recall (40%?)
    • Extraction of complex relations (not just triples + coref)
    • Bridging existing KGs with text
    • Relevant information extraction
    • Query-specific knowledge graphs
  • Fernando Pereira
    • combing source correlation and grounding
  • Guy van den Broeck
    • Do more than link predication
    • Tear down the wall between query evaluation and knowledge base completion
    • The open world assumption – take it seriously
  • Waleed Ammar
    • Bridge sentence level and document level predictions
    • Summarize published results on a given problem
    • Develop tools to facilitate peer review
    • How do we crowd source annotations for a specialized domain
    • What are leading indicators of a papers impact?
  • Sebastian Riedel
    • Determine what BERT actually knows or what it’s guessing
  • Xian Ren
    • Where can we source complex rules that help AKBC?
    • How do we induce transferrable latent structures from pre-trained models?
    • Can we have modular neural networks for modeling compositional rules?
    • Ho do we model “human effort” in the objective function during training?
  • Matt Gardner
    • Make hard reading datasets by baking required reasoning into them

Finally, I think the biggest challenge that was laid down was from Claudia Wagner, which is how to think a bit more introspectively about the theory behind our AKBC methods and how we might even bring the rigor of social science methodology to our technical approaches:

I left AKBC 2019 with a fountain of ideas and research questions, which I count as a success. This is a community to watch.  AKBC 2020 is definitely on my list of events to attend next year.

Random Pointers


Two weeks ago, I had the pleasure of attending the 17th International Semantic Web Conference held at Asiolomar Conference Grounds in California. A tremendously beautiful setting in a state park along the ocean. This trip report is somewhat later than normal because I took the opportunity to hang out for another week along the coast of California.

Before getting into the content of the conference, I think it’s worth saying, if you don’t believe that there are capable, talented, smart and awesome women in computer science at every level of seniority, the ISWC 2018 organizing committee + keynote speakers is the mike drop of counter examples:

Now some stats:

  •  438 attendees
  •  Papers
    •  Research Track: 167 submissions – 39 accepted – 23% acceptance rate
    •  In Use: 55 submissions – 17 accepted – 31% acceptance rate
    •  Resources: 31 submissions – 6 accepted – 19% acceptance rate
  •  38 Posters & 39 Demos
  • 14 industry presentations
  • Over 1000 reviews

These are roughly the same as the last time ISWC was held in the United States. So on to the major themes I took away from the conference plus some asides.

Knowledge Graphs as enterprise assets

It was hard to walk away from the conference without being convinced that knowledge graphs are becoming fundamental to delivering modern information solutions in many domains. The enterprise knowledge graph panel was a demonstration of this idea. A big chunk of the majors were represented:

The stats are impressive. Google’s Knowledge Graph has 1 billion things and 70 billion assertions. Facebook’s knowledge graph which they distinguish from their social graph and has just ramped up this year has 50 Million Entities and 500 million assertions. More importantly, they are critical assets for applications, for example, at eBay their KG is central to creating product pages, at Google and Microsoft, KGs are key to entity search and assistants, and at IBM they use it as part of their corporate offerings. But you know it’s really in-use when knowledge graphs are used for emoji:

It wasn’t just the majors who have or are deploying knowledge graphs. The industry track in particular was full of good examples of knowledge graphs being used in practice. Some ones that stood out were: Bosch’s use of knowledge graphs for question answering in DIY, multiple use cases for digital twin management (Siemens, Aibel); use in a healthcare chatbot (Babylon Health); and for helping to regulate the US finance industry (FINRA). I was also very impressed with Diffbot’s platform for creating KGs from the Web. I contributed to the industry session presenting how Elsevier is using knowledge graphs to drive new products in institutional showcasing and healthcare.

Beyond the wide use of knowledge graphs, there was a number of things I took away from this thread of industrial adoption.

  1. Technology heterogeneity is really the norm. All sorts of storage, processing and representation approaches were being used. It’s good we have the W3C Semantic Web stack but it’s even better that the principles of knowledge representation for messy data are being applied. This is exemplified by Amazon Neptune’s support for TinkerPop & SPARQL.
  2. It’s still hard to build these things. Microsoft said it was hard at scale. IBM said it was hard for unique domains. I had several people come to me after my talk about Elsevier’s H-Graph discussing similar challenges faced in other organizations that are trying to bring their data together especially for machine learning based applications. Note, McCusker’s work is some of the better publicly available thinking on trying to address the entire KG construction lifecycle.
  3. Identity is a real challenge. I think one of the important moves in the success of knowledge graphs was not to over ontologize. However, record linkage and thinking when to unify an entity is still not a solved problem. One common approach was towards moving the creation of an identifiable entity closer to query time to deal with the query context but that removes the shared conceptualization that is one of the benefits of a Knowledge Graph. Indeed, the clarion call by Google’s Jamie Taylor to teach knowledge representation was an outcome of the need for people who can think about these kinds of problem.

In terms of research challenges, much of what was discussed reflects the same kinds of ideas that were discussed at the recent Dagstuhl Knowledge Graph Seminar so I’ll point you to my summary from that event.

Finally, for most enterprises, their knowledge graph(s) were considered a unique asset to the company. This led to an interesting discussion about how to share “common knowledge” and the need to be able to merge such knowledge with local knowledge. This leads to my next theme from the conference.

Wikidata as the default option

When discussing “common knowledge”, Wikidata has become a focal point. In the enterprise knowledge graph panel, it was mentioned as the natural place to collaborate on common knowledge. The mechanics of the contribution structure (e.g. open to all, provenance on statements) and institutional attention/authority (i.e. Wikimedia foundation) help with this. An example of Wikidata acting as a default is the use of Wikidata to help collate data on genes

Fittingly enough, Markus Krötzsch and team won the best in-use paper with a convincing demonstration of how well semantic technologies have worked as the query environment for Wikidata. Furthermore, Denny Vrandečić (one of the founders of Wikidata) won the best blue sky paper with the idea of rendering Wikipedia articles directly from Wikidata.

Deep Learning diffusion

As with practically every other conference I’ve been to this year, deep learning as a technique has really been taken up. It’s become just part of the semantic web researchers toolbox. This was particularly clear in the knowledge graph construction area. Papers I liked with DL as part of the solution:

While not DL per sea , I’ll lump embeddings in this section as well. Papers I thought that were interesting are:

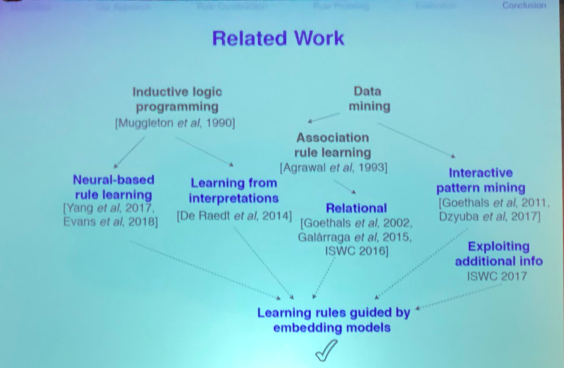
The presentation of the above paper was excellent. I particularly liked their slide on related work:

iswc2018-1fd3fcf3.png

As an aside, the work on learning rules and the complementarity of rules to other forms of prediction was an interesting thread in the conference. Besides the above paper, see the work from Heiner Stuckenschmidt’s group on evaluating rules and embedding approaches for knowledge graph completion. The work of Fabian Suchanek’s group on the representativeness of knowledge bases is applicable as well in order to tell whether rule learning from knowledge graphs is coming from a representative source and is also interesting in its own right. Lastly, I thought the use of rules in Beretta et al.’s work to quantify the evidence of an assertion in a knowledge graph to help improve reliability was neat.

Information Quality and Context of Use

The final theme is a bit harder for me to solidify and articulate but it lies at the intersection of information quality and how that information is being used. It’s not just knowing the provenance of information but it’s knowing how information propagates and was intended to be used. Both the upstream and downstream need to be considered. As a consumer of information I want to know the reliability of the information I’m consuming. As a producer I want to know if my information is being used for what it was intended for.

The later problem was demonstrated by the keynote from Jennifer Golbeck on privacy. She touched on a wide variety of work but in particular it’s clear that people don’t know but are concerned with what is happening to their data.

There was also quite a bit of discussion going on about the decentralized web and Tim Berners-Lee’s Solid project throughout the conference. The workshop on decentralization was well attended. Something to keep your eye on.

The keynote by Natasha Noy also touched more broadly on the necessity of quality information this time with respect to scientific data.

The notion of propagation of bias through our information systems was also touched on and is something I’ve been thinking about in terms of data supply chains:

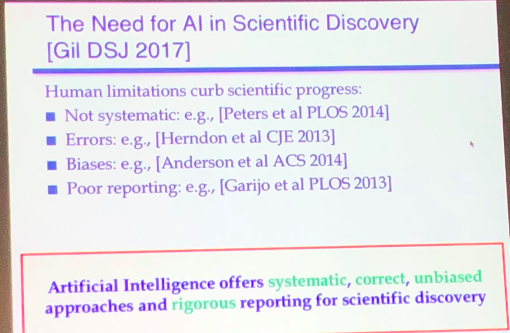
That being said I think there’s an interesting path forward for using technology to address these issues. Yolanda Gil’s work on the need for AI to address our own biases in science is a step forward in that direction. This is a slide from her excellent keynote at SemSci Workshop:

iswc2018-09cc97c4.png

All this is to say that this is an absolutely critical topic and one where the standard “more research is needed” is very true. I’m happy to see this community thinking about it.

Final Thought

The Semantic Web community has produced a lot (see this slide from Nataha’s keynote:

iswc2018-d5af2fed.png

ISWC 2018 definitely added to that body of knowledge but more importantly I think did a fantastic job of reinforcing and exciting the community.

Random Notes

Last week, I was at Dagstuhl for a seminar on knowledge graphs specifically focused on new directions for knowledge representation. Knowledge Graphs have exploded in practice since the release of Google’s Knowledge Graph in 2012. Examples include knowledge graphs at AirBnb, Zalando, and Thomson Reuters. Beyond commercial knowledge graphs, there are many successful academic/public knowledge graphs including WikiData, Yago, and Nell.

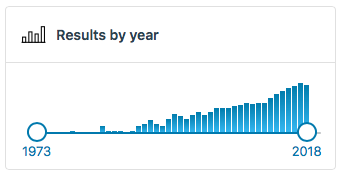
The emergence of these knowledge graphs has led to expanded research interest in constructing, producing and maintaining knowledge bases. As an indicator checkout the recent growth in papers using the term knowledge graph (~10x papers per year since 2012):

knowledgegraph-dagstuhl-20180910-f32c5b3e.png

The research in this area is found across fields of computer science ranging from the semantic web community to natural language processing and machine learning and databases. This is reflected in the recent CFP for the new Automated Knowledge Base Construction Conference.

This particular seminar primarily brought together folks who had a “home” community in the semantic web but were deeply engaged with another community. For example, Prof. Maria-Esther Vidal who is well versed in the database literature. This was nice in that there was already quite a lot of common ground but people who could effectively communicate or at least point to what’s happening in other areas. This was different than many of the other Dagstuhl seminars I’ve been to (this was my 6th), which were much more about bringing together different areas. I think both styles are useful but it felt like we could go faster as the language barrier was lower.

The broad aim of the seminar was to come with research challenges coming from the experience that we’ve had over the last 10 years. There will be a follow-up report that should summarize the thoughts of the whole group. There were a lot of sessions and a lot of amazing discussions both during the day and in the evening facilitated by cheese & wine (a benefit of Dagstuhl) so it’s hard to summarize everything even just on a personal level but I wanted to pull out the things that have stuck with me now that I’m back at home:

1) Knowledge Graphs of Everything

We are increasingly seeing knowledge graphs that cover an entire category of entities. For example, Amazon’s product graph aims to be a knowledge graph of all products in the world, one can think of Google and Apple maps as databases of every location in the world, a database of every company that has ever had a web page, or a database of everyone in India. Two things stand out. One, is that these are large sets of instance data. I would contend their focus is not deeply modeling the domain in some expressive logic ala Cyc. Second, a majority of these databases are built by private companies. I think it’s an interesting question as to whether things like Wikidata can equal these private knowledge graphs in a public way.

Once you start thinking at this scale, a number of interesting questions arise: how you keep these massive graphs up to date; can you integrate these graphs, how do you manage access control and policies (“controlled access”); what can you do with this; can we extend these sorts of graphs to the physical system (e.g. in IoT); what about a knowledge graph of happenings (ie. events). Fundamentally, I think this “everything notion” is a useful framing device for research challenges.

2) Knowledge Graphs as a communication medium

A big discussion point during the seminar was the integration of symbolic and sub-symbolic representations. I think that’s obvious given the success of deep learning and importantly in the representation space – embeddings. I liked how Michael Witbrock framed symbols as a strong prior on something being the case. Indeed, using background knowledge has been shown to improve learning performance on several tasks (e.g. Baier et al. 2018, Marino et al. 2017).

But this topic in general got us thinking about the usefulness of knowledge graphs as an exchange mechanism for machines. There’s is a bit of semantic web dogma that expressing things in a variant of logic helps for machine to machine communication. This is true to some degree but you can imagine that machines might like to consume a massive matrix of numbers instead of human readable symbols with logical operators.

Given that, then, what’s the role of knowledge graphs? One can hypothesize that it is for the exchange of large scale information between humanity and machines and vis versa. Currently, when people communicate large amounts of data they turn towards structure (i.e. libraries, websites with strong information architectures, databases). Why not use the same approach to communicate with machines then. Thus, knowledge graphs can be thought of as a useful medium of exchange between what machines are generating and what humanity would like to consume.

On a somewhat less grand note, we discussed the role of integrating different forms of representation in one knowledge graph. For example, keeping images represented as images and audio represented as audio alongside facts within the same knowledge graph. Additionally, we discussed different mechanisms for attaching semantics to the symbols in knowledge graphs (e.g. latent embeddings of symbols). I tried to capture some of that thinking in a brief overview talk.

In general, as we think of knowledge graphs as a communication medium we should think how to both tweak and expand the existing languages of expression we use for them and the semantics of those languages.

3) Knowledge graphs as social-technical processes

The final kind of thing that stuck in my mind is that at the scale we are talking about much of the issues resolve around the notions of the complex interplay between humans and machines in producing, using and maintaining knowledge graphs. This was reflected in multiple threads:

  • Juan Sequeda’s thinking emerging from his practical experience on the need for knowledge / data engineers to build knowledge graphs and the lack of tooling for them. In some sense, this was a call to revisit the work of ontology engineering but now in the light of this larger scale and extensive adoption.
  • The facts established by the work of Wouter Beek and co on empirical semantics that in large scale knowledge graphs actually how people express information differs from the intended underlying semantics.
  • The notions of how biases and perspectives are reflected in knowledge graphs and the steps taken to begin to address these. A good example is the work of wikidata community to present the biases and gaps in its knowledge base.
  • The success of schema.org and managing the overlapping needs of communities. This stood out because of the launch of Google Dataset search service based on schema.org metadata.

While not related directly to knowledge graphs during the seminar the following piece on the relationship between AI systems and humans came was circulating:

Kate Crawford and Vladan Joler, “Anatomy of an AI System: The Amazon Echo As An Anatomical Map of Human Labor, Data and Planetary Resources,” AI Now Institute and Share Lab, (September 7, 2018) https://anatomyof.ai

There is critical need for more data about the interface between the knowledge graph and its maintainers and users.

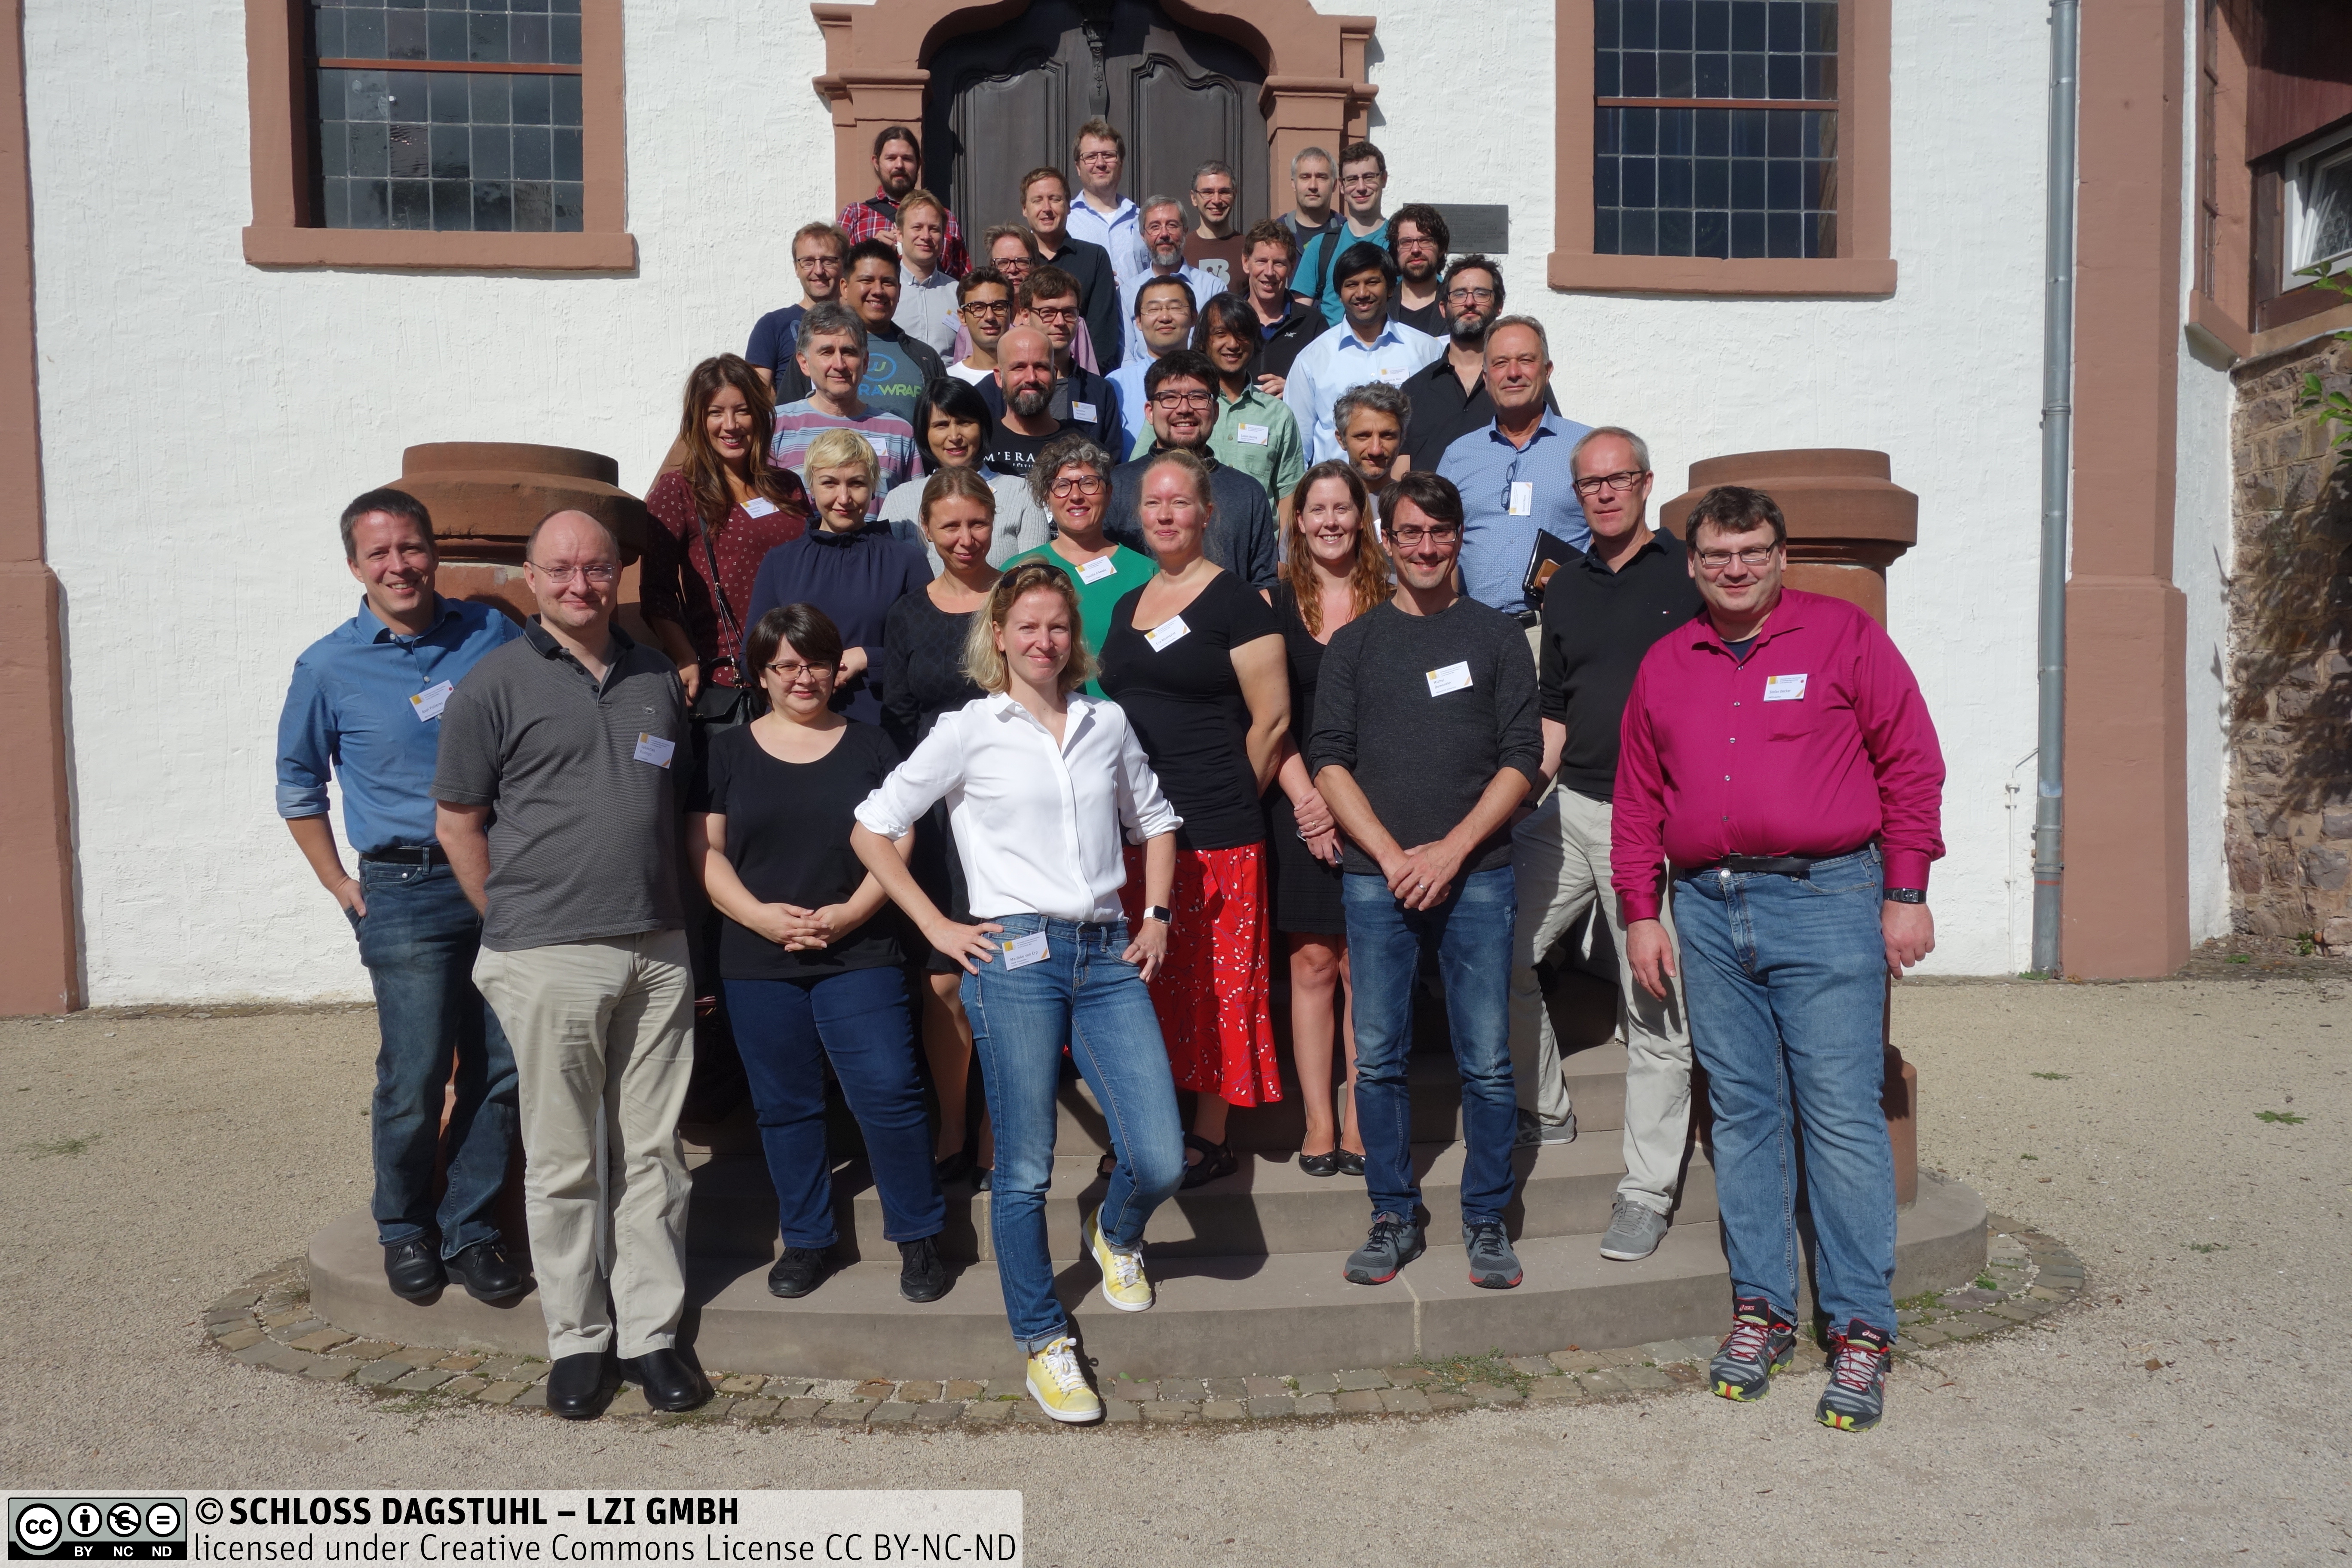
As I mentioned, there was lots more that was discussed and I hope the eventual report will capture this. Overall, it was fantastic to spend a week with the people below – both fun and thought provoking.

Random ponters:

A couple of weeks ago I was at Provenance Week 2018 – a biennial conference that brings together various communities working on data provenance. Personally, it’s a fantastic event as it’s an opportunity to see the range of work going on from provenance in astronomy data to the newest work on database theory for provenance. Bringing together these various strands is important as there is work from across computer science that touches on data provenance.

The week is anchored by the International Provenance and Annotation Workshop (IPAW) and the Theory and Practice of Provenance (TaPP) and includes events focused on emerging areas of interest including incremental re-computation , provenance-based security and algorithmic accountability. There were 90 attendees up from ~60 in the prior events and here they are:

IMG_0626-2.jpg

The folks at Kings College London, led by Vasa Curcin, did a fantastic job of organizing the event including great social outings on-top of their department building and with a boat ride along the thames. They also catered to the world cup fans as well. Thanks Vasa!

2018-07-11 21.29.07

I had the following major takeaways from the conference:

Improved Capture Systems

The two years since the last provenance week have seen a number of improved systems for capturing provenance. In the systems setting, DARPAs Transparent Computing program has given a boost to scaling out provenance capture systems. These systems use deep operating system instrumentation to capture logs over the past several years these have become more efficient and scalable e.g. Camflow, SPADE. This connects with the work we’ve been doing on improving capture using whole system record-and-replay. You  can now run these systems almost full-time although they capture significant amounts of data (3 days = ~110 GB). Indeed, the folks at Galois presented an impressive looking graph database specifically focused on working with provenance and time series data streaming from these systems.

Beyond the security use case, sciunit.run was a a neat tool using execution traces to produce reproducible computational experiments.

There were also a number of systems for improving the generation of instrumentation to capture provenance. UML2PROV automatically generates provenance instrumentation from UML diagrams and source code using the provenance templates approach. (Also used to capture provenance in an IoT setting.) Curator implements provenance capture for micro-services using existing logging libraries. Similarly, UNICORE now implements provenance for its HPC environment. I still believe structured logging is one of the under rated ways of integrating provenance capture into systems.

Finally, there was some interesting work on reconstructing provenance. In particular, I liked Alexander Rasin‘s work on reconstructing the contents of a database from its environment to answer provenance queries:2018-07-10 16.34.08.jpg

Also, the IPAW best paper looked at using annotations in a workflow to infer dependency relations:

Lastly, there was some initial work on extracting provenance of  health studies directly from published literature which I thought was a interesting way of recovering provenance.

Provenance for Accountability

Another theme (mirrored by the event noted above) was the use of provenance for accountability. This has always been a major use for provenance as pointed out by Bertram Ludäscher in his keynote:

However, I think due to increasing awareness around personal data usage and privacy the need for provenance is being recognized. See, for example, the Royal Society’s report on Data management and use: Governance in the 21st century. At Provenance Week, there were several papers addressing provenance for GDPR, see:

Also, the I was impressed with the demo from Imosphere using provenance for accountability and trust in health data:

Re-computation & Its Applications

Using provenance to determine what to recompute seems to have a number of interesting applications in different domains. Paolo Missier showed for example how it can be used to determine when to recompute in next generation sequencing pipelines.

I particular liked their notion of a re-computation front – what set of past executions do you need to re-execute in order to address the change in data.

Wrattler was a neat extension of the computational notebook idea that showed how provenance can be used to automatically propagate changes through notebook executions and support suggestions.

Marta Mattoso‘s team discussed the application of provenance to track the adjustments when performing steering of executions in complex HPC applications.

The work of Melanie Herschel‘s team on provenance for data integration points to the benefits of potentially applying recomputation using provenance to make the iterative nature of data integration speedier as she enumerated in her presentation at the recomputation worskhop.2018-07-12 15.01.42.jpg

You can see all the abstracts from the workshop here. I understand from Paolo that they will produce a report from the discussions there.

Overall, I left provenance week encouraged by the state of the community, the number of interesting application areas, and the plethora of research questions to work on.

Random Links


%d bloggers like this: