Join GitHub today
GitHub is home to over 28 million developers working together to host and review code, manage projects, and build software together.
Sign upMissing nodes in GEXF output files (on AUK) #25
Comments
 ianmilligan1
added
the
bug
label
ianmilligan1
added
the
bug
label
Aug 23, 2018
ianmilligan1
assigned
greebie
Aug 23, 2018
This comment has been minimized.
Show comment
Hide comment
This comment has been minimized.
greebie
Aug 27, 2018
Collaborator
These appear to be nodes that only link to themselves. For example, search for "hermanleonard.com" in the test example. Gephi handles these by providing a loop back representation (shown above), sigma does not support self-links. However, apparently switching the edge type to "curved" looks more attractive and may resolve the problem. cf
There are also plugins available to support self-referential links.
It is possible to remove self-referential links in Graphpass completely if desired.
greebie
commented
Aug 27, 2018
•
edited
Edited 1 time
-
 greebie
edited
greebie
edited Aug 27, 2018 (most recent)
-
greebie
created Aug 27, 2018
edited
-
Aug 27, 2018 (most recent) -
Aug 27, 2018
|
These appear to be nodes that only link to themselves. For example, search for "hermanleonard.com" in the test example. Gephi handles these by providing a loop back representation (shown above), sigma does not support self-links. However, apparently switching the edge type to "curved" looks more attractive and may resolve the problem. cf There are also plugins available to support self-referential links. It is possible to remove self-referential links in Graphpass completely if desired. |
This comment has been minimized.
Show comment
Hide comment
This comment has been minimized.
|
Why are the edges pointing at blank space then? |
This comment has been minimized.
Show comment
Hide comment
This comment has been minimized.
greebie
Aug 27, 2018
Collaborator
Okay - after further exploration, it looks as if some nodes are collecting negative sizes. This probably happens when Graphpass tries to figure out a reasonable sizing pattern for the nodes. I will try to resolve tomorrow.
|
Okay - after further exploration, it looks as if some nodes are collecting negative sizes. This probably happens when Graphpass tries to figure out a reasonable sizing pattern for the nodes. I will try to resolve tomorrow. |
This comment has been minimized.
Show comment
Hide comment
This comment has been minimized.
greebie
Aug 28, 2018
Collaborator
Looks like I am using the node count for the graph size and that creates problems when the max node sizes - min node size value is equal to the node size. Will switch to the number of edges instead.
|
Looks like I am using the node count for the graph size and that creates problems when the max node sizes - min node size value is equal to the node size. Will switch to the number of edges instead. |
This comment has been minimized.
Show comment
Hide comment
This comment has been minimized.
greebie
Aug 28, 2018
Collaborator
Okay -- here is the full explanation of the bug, complete with mathematics. :)
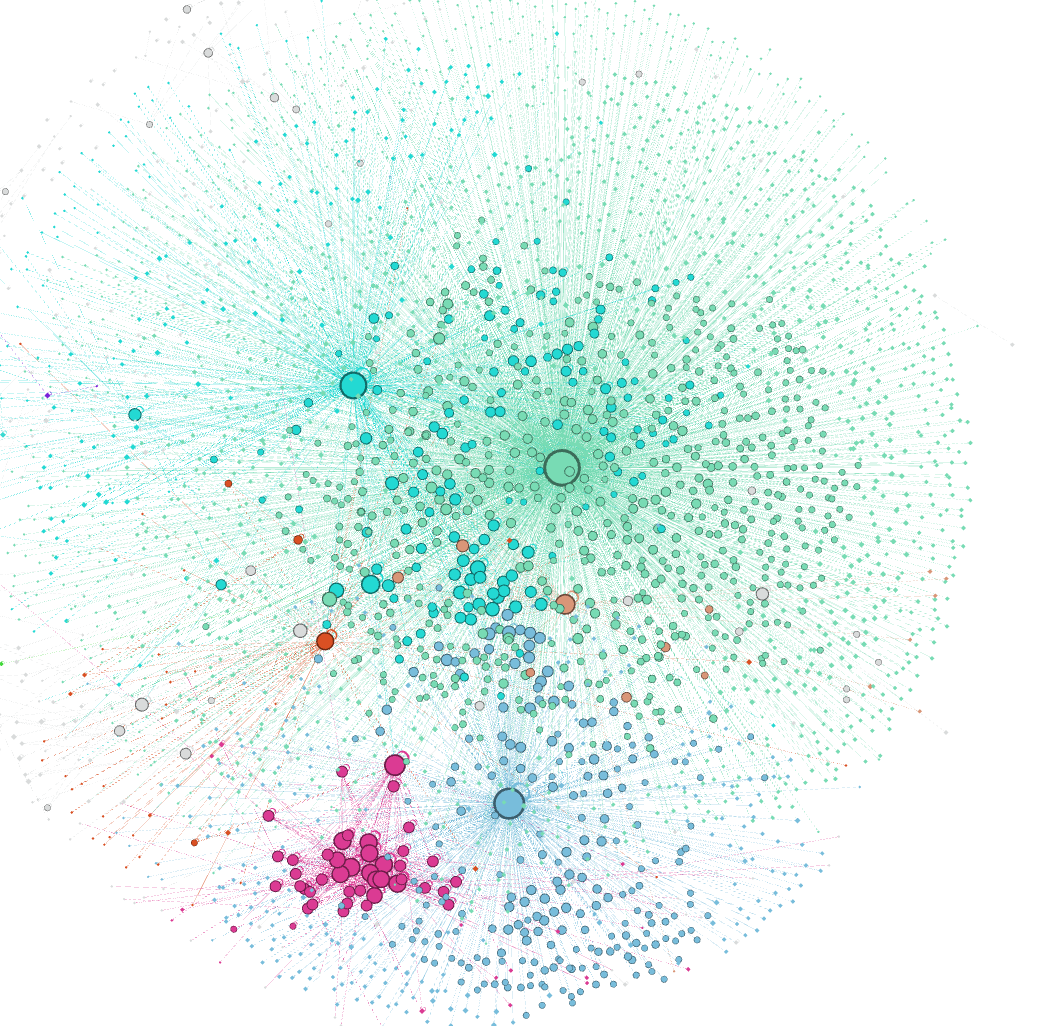
Because our network outputs in aut contain websites with lots and lots of links and others with very few, it can be difficult to visualise the outputs in gephi or otherwise using the total links. For instance, it's common to get this:
In order to make it possible to view the nodes together in a more visually appealing way, it's common to use a scale of some sort. You could take the square root of each number, for instance, or cut the nodes in half, so that a node of size 1000 goes to 500 while a node of size 2 goes to 1.
The calculation I used was to multiply every node by log10( total number of nodes in the graph / (degree of largest node - degree of smallest node)). This worked fine when the denominator of the function was less than the total nodes, but failed when it was larger because the scale would all be negative numbers. This meant that sigma had no basis on which to scale.
Basically, I was fooled into believing this approach worked generally because sigma did its own massaging.
The new approach will be more correct and will provide an attractive output for both sigma and gephi (or any other visualisation tool).
It uses the following:
MAX_SCALE_VALUE * ((log(x +1) - log(minimum +1)) / (log(maximum +1) - log(minimum +1))
where
- x = the actual degree value for each node.
- minimum = the lowest degree value
- maximum = the highest degree value
Each of x, minimum and maximum are increased by one to avoid log(0) which is undefined.
|
Okay -- here is the full explanation of the bug, complete with mathematics. :) Because our network outputs in aut contain websites with lots and lots of links and others with very few, it can be difficult to visualise the outputs in gephi or otherwise using the total links. For instance, it's common to get this:
In order to make it possible to view the nodes together in a more visually appealing way, it's common to use a scale of some sort. You could take the square root of each number, for instance, or cut the nodes in half, so that a node of size 1000 goes to 500 while a node of size 2 goes to 1. The calculation I used was to multiply every node by log10( total number of nodes in the graph / (degree of largest node - degree of smallest node)). This worked fine when the denominator of the function was less than the total nodes, but failed when it was larger because the scale would all be negative numbers. This meant that sigma had no basis on which to scale. Basically, I was fooled into believing this approach worked generally because sigma did its own massaging. The new approach will be more correct and will provide an attractive output for both sigma and gephi (or any other visualisation tool). It uses the following:
where
Each of x, minimum and maximum are increased by one to avoid log(0) which is undefined. |
This comment has been minimized.
Show comment
Hide comment
This comment has been minimized.
greebie
Aug 28, 2018
Collaborator
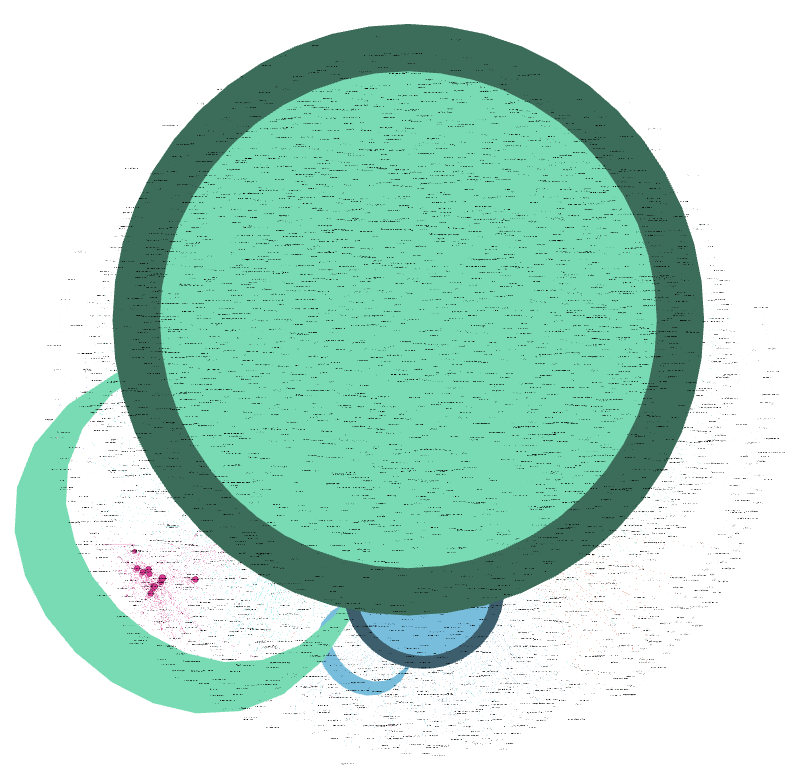
Using the new formula, this is what the same graph looks like in Gephi.
However, we should do some serious testing in sigma to make sure it works properly.
|
Using the new formula, this is what the same graph looks like in Gephi. However, we should do some serious testing in sigma to make sure it works properly. |
ianmilligan1 commentedAug 23, 2018
Describe the bug
On a few collections, we have sigma js network visualizations that have misplaced nodes. Edges point to blank space, and nodes are hovering arbitrary. Here's an example from sigma:
The same thing appears when the GEXF file is opened in Gephi:
The original GRAPHML file (pre GraphPass transformation), however, has edges properly connected to nodes.
Something is going awry with GraphPass, presumably in the x/y placement of nodes.
To Reproduce
Find a broken collection. There doesn't seem to be a universal rhyme or reason for why this happens.
@greebie I will send you the before/after file of the collection above, so you can work on GraphPass to fix it.
Expected behavior😄
Edges and nodes should connect.
Desktop/Laptop (please complete the following information):
@ruebot and I have reproduced this on Safari, Chrome, and Firefox on both Linux and Windows. The Gephi test pretty firmly indicates that it is a GraphPass related issue.