Trip Report: Dagstuhl Seminar on Knowledge Graphs
Last week, I was at Dagstuhl for a seminar on knowledge graphs specifically focused on new directions for knowledge representation. Knowledge Graphs have exploded in practice since the release of Google’s Knowledge Graph in 2012. Examples include knowledge graphs at AirBnb, Zalando, and Thomson Reuters. Beyond commercial knowledge graphs, there are many successful academic/public knowledge graphs including WikiData, Yago, and Nell.
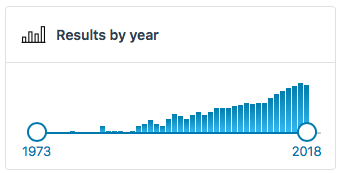
The emergence of these knowledge graphs has led to expanded research interest in constructing, producing and maintaining knowledge bases. As an indicator checkout the recent growth in papers using the term knowledge graph (~10x papers per year since 2012):
The research in this area is found across fields of computer science ranging from the semantic web community to natural processing and machine learning and databases. This is reflected in the recent CFP for the new Automated Knowledge Base Construction Conference.
This particular seminar primarily brought together folks who had a “home” community in the semantic web but were deeply engaged with another community. For example, Prof. Maria-Esther Vidal who is well versed in the database literature. This was nice in that there was already quite a lot of common ground but people who could effectively communicate or at least point to what’s happening in other areas. This was different than many of the other Dagstuhl seminars I’ve been to (this was my 6th), which were much more about bringing together different areas. I think both styles are useful but it felt like we could go faster as the language barrier was lower.
The broad aim of the seminar was to come with research challenges coming from the experience that we’ve had over the last 10 years. There will be a follow-up report that should summarize the thoughts of the whole group. There were a lot of sessions and a lot of amazing discussions both during the day and in the evening facilitated by cheese & wine (a benefit of Dagstuhl) so it’s hard to summarize everything even just on a personal level but I wanted to pull out the things that have stuck with me now that I’m back at home:
1) Knowledge Graphs of Everything
We are increasingly seeing knowledge graphs that cover an entire category of entities. For example, Amazon’s product graph aims to be a knowledge graph of all products in the world, one can think of Google and Apple maps as databases of every location in the world, a database of every company that has ever had a web page, or a database of everyone in India. Two things stand out. One, is that these are large sets of instance data. I would contend their focus is not deeply modeling the domain in some expressive logic ala Cyc. Second, a majority of these databases are build by private companies. I think it’s an interesting question as to whether things like Wikidata can equal these private knowledge graphs in a public way.
Once you start thinking at this scale, a number of interesting questions arise: how you keep these massive graphs up to date; can you integrate these graphs, how do you manage access control and policies (“controlled access”); what can you do with this; can we extend these sorts of graphs to the physical system (e.g. in IoT); what about a knowledge graph of happenings (ie. events). Fundamentally, I think this “everything notion” is a useful framing device for research challenges.
2) Knowledge Graphs as a communication medium
A big discussion point during the seminar was the integration of symbolic and sub-symbolic representations. I think that’s obvious given the success of deep learning and importantly in the representation space – embeddings. I liked how Michael Witbrock framed symbols as a strong prior on something being the case. Indeed, using background knowledge has been shown to improve learning performance on several tasks (e.g. Baier et al. 2018, Marino et al. 2017).
But this topic in general got us thinking about the usefulness of knowledge graphs as an exchange mechanism for machines. There’s is a bit of semantic web dogma that expressing things in a variant of logic helps for machine to machine communication. This is true to some degree but you can image that machine’s might like to consume a massive matrix of numbers instead of human readable symbols with logical operators.
Given that, then, what’s the role of knowledge graphs? One can hypothesize that it is for the exchange of large scale information between humanity and machines and vis versa. Currently, when people communicate large amounts of data they turn towards structure (i.e. libraries, websites with strong information architectures, databases). Why not use the same approach to communicate with machines then. Thus, knowledge graphs can be thought of as a useful medium of exchange between what machines are generating and what humanity would like to consume.
On a somewhat less grand note, we discussed the role of integrating different forms of representation in one knowledge graph. For example, keeping images represented as images and audio represented as audio alongside facts within the same knowledge graph. Additionally, we discussed different mechanisms for attaching semantics to the symbols in knowledge graphs (e.g. latent embeddings of symbols). I tried to capture some of that thinking in a brief overview talk.
In general, as we think of knowledge graphs as a communication medium we should think how to both tweak and expand the existing languages of expression we use for them and the semantics of those languages.
3) Knowledge graphs as social-technical processes
The final kind of thing that stuck in my mind is that at the scale we are talking about much of the issues resolve around the notions of the complex interplay between humans and machines in producing, using and maintaining knowledge graphs. This was reflected in multiple threads:
- Juan Sequeda’s thinking emerging from his practical experience on the need for knowledge / data engineers to build knowledge graphs and the lack of tooling for them. In some sense, this was a call to revisit the work of ontology engineering but now in the light of this larger scale and extensive adoption.
- The facts established by the work of Wouter Beek and co on empirical semantics that in large scale knowledge graphs actually how people express information differs from the intended underlying semantics.
- The notions of how biases and perspectives are reflected in knowledge graphs and the steps taken to begin to address these. A good example is the work of wikidata community to present the biases and gaps in its knowledge base.
- The success of schema.org and managing the overlapping needs of communities. This stood out because of the launch of Google Dataset search service based on schema.org metadata.
While not related directly to knowledge graphs during the seminar the following piece on the relationship between AI systems and humans came was circulating:
Kate Crawford and Vladan Joler, “Anatomy of an AI System: The Amazon Echo As An Anatomical Map of Human Labor, Data and Planetary Resources,” AI Now Institute and Share Lab, (September 7, 2018) https://anatomyof.ai
There is critical need for more data about the interface between the knowledge graph and its maintainers and users.
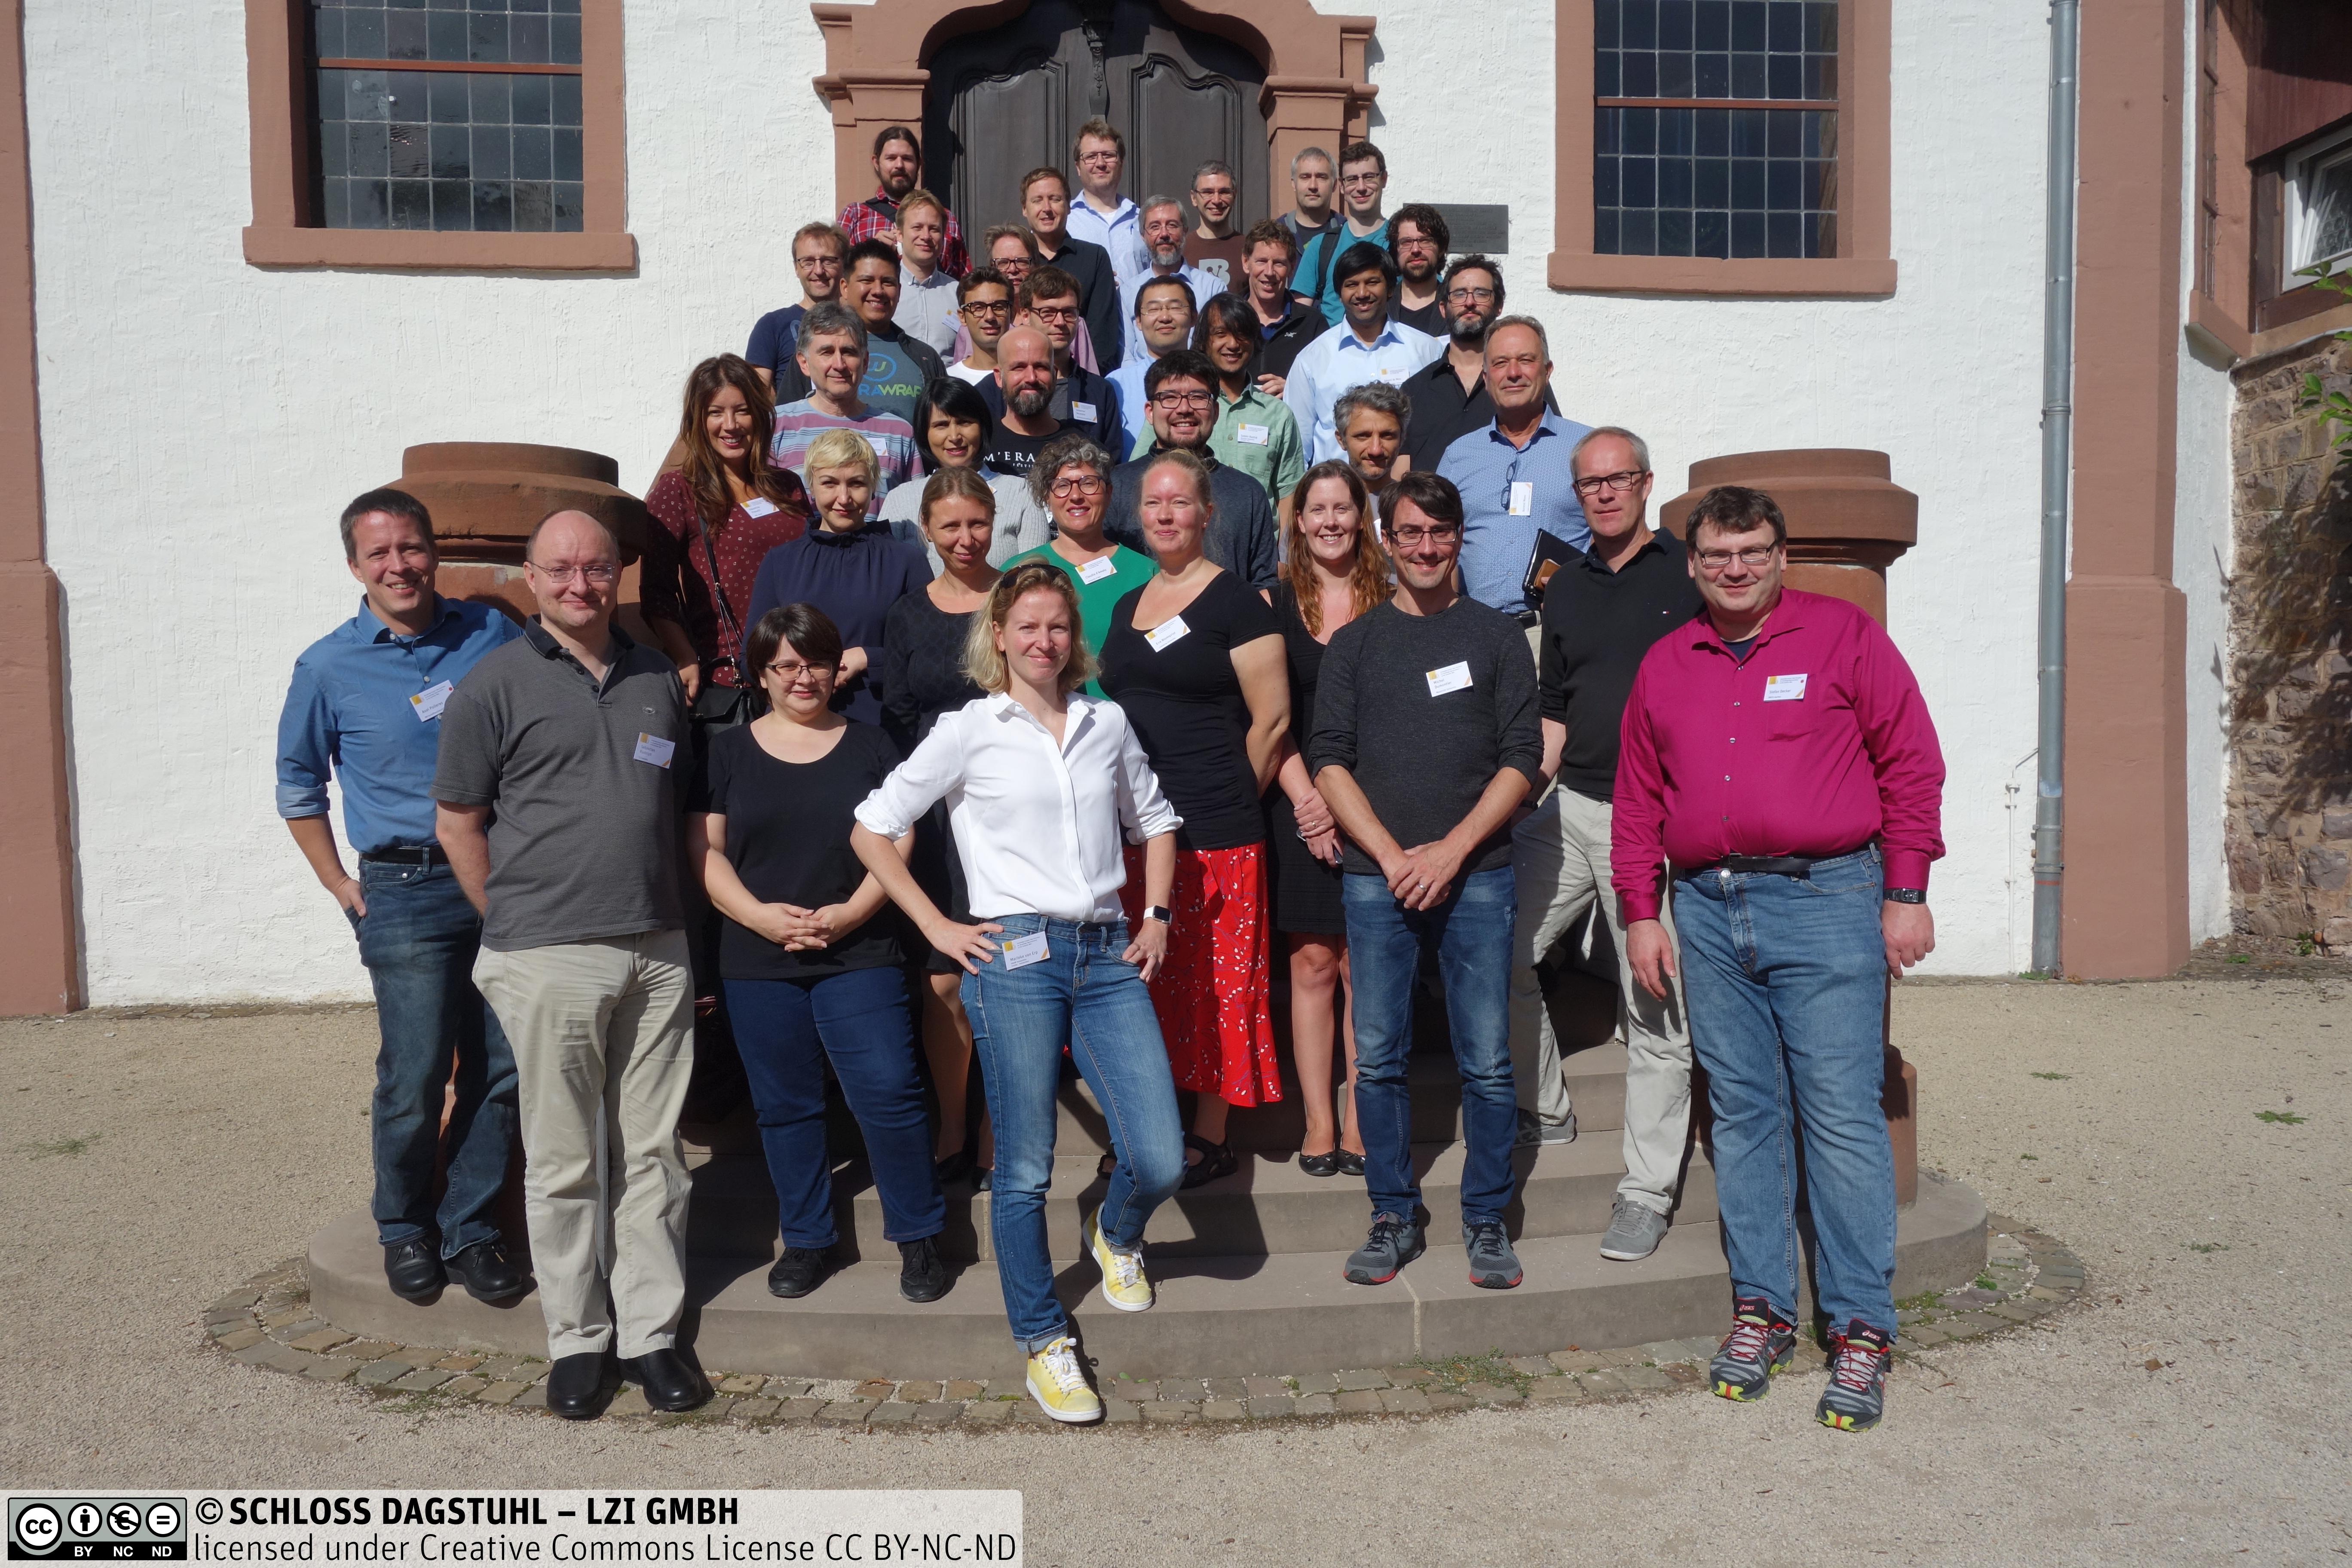
As I mentioned, there was lots more that was discussed and I hope the eventual report will capture this. Overall, it was fantastic to spend a week with the people below – both fun and thought provoking.
Random ponters:
- A very nice write-up from Eva Blomqvist [http://blog.liu.se/semanticweb/2018/09/15/dagstuhl-seminar-on-knowledge-graphs/]
- Definitions! – Obviously we need a lattice. Or we just embrace the notion that its an inclusive concept…. this is something I like.
- 1974 – E. Marchi, O. Miguel. On the structure of the teaching-learning interactive process. International Journal of Game Theory, Physica-Verlag (1974)
- Section 2….
- 25 years of knowledge graph theory…
- I want to be able to do super fast nice presentations like Aidan Hogan
- Are we trying to create a theory of knowledge + data at scale? – Frank van Harmelen
- Three tutorials on knowledge graphs:
- Mining Knowledge Graphs from Text
- Building a Large-scale, Accurate and Fresh Knowledge Graph
- Constructing Domain-specific Knowledge Graphs (KGC)
