Join GitHub today
GitHub is home to over 31 million developers working together to host and review code, manage projects, and build software together.
Sign upAdd image / screen capture download. #issue-255 #268
Conversation
This comment has been minimized.
This comment has been minimized.
codecov-io
commented
Feb 25, 2019
•
Codecov Report
@@           Coverage Diff           @@
##           master     #268   +/-   ##
=======================================
  Coverage   96.39%   96.39%
=======================================
  Files          35       35
  Lines         555      555
=======================================
  Hits          535      535
  Misses         20       20
Continue to review full report at Codecov.
|
This comment has been minimized.
This comment has been minimized.
|
Thanks - will test locally on my end, @greebie! |
This comment has been minimized.
This comment has been minimized.
|
cool! Thanks @greebie, excited to test this out :) |
This comment has been minimized.
This comment has been minimized.
|
Got it working locally - nice! Is it possible so that the "export" button exports the entire graph, not just what's visible in the view? i.e. right now you get cut off exports i.e. if only part of the network is visible in the pane. I was thinking the export could generate the entire graph, even if it isn't in the view. |
This comment has been minimized.
This comment has been minimized.
|
I cannot think of a way to implement that off the top of my head. Unfortunately, from javascript, I can only duplicate what exists in the canvas. It might be possible to use another library to save a graph image from the gexf the way we do derivatives. It is possible to increase the image quality, so that the overall image is larger. |
This comment has been minimized.
This comment has been minimized.
|
Fair enough – I don't think we want to spend too much time on this. What would enhanced image quality look like? |
This comment has been minimized.
This comment has been minimized.
|
Makes sense that it's really only what's in the viewport that you can export since that's the camera. Islandora does a similar thing with OpenSeadragon, and the export is what is in the viewport as well. |
ianmilligan1
approved these changes
Feb 26, 2019
|
FWIW works well on my end as a user, put this through the paces and all works. But as discussed, we may want to change output filenames. |
This comment has been minimized.
This comment has been minimized.
|
Latest commit add x, y and ratio coordinates to filename. That might be overkill, but I thought it would be easier to remove something than trying to find the values in the DOM again later on. I also use absolute values instead of integers. |
This comment has been minimized.
This comment has been minimized.
|
@greebie sounds good! I'll try and get this tested in the next couple days. |

greebie commentedFeb 25, 2019
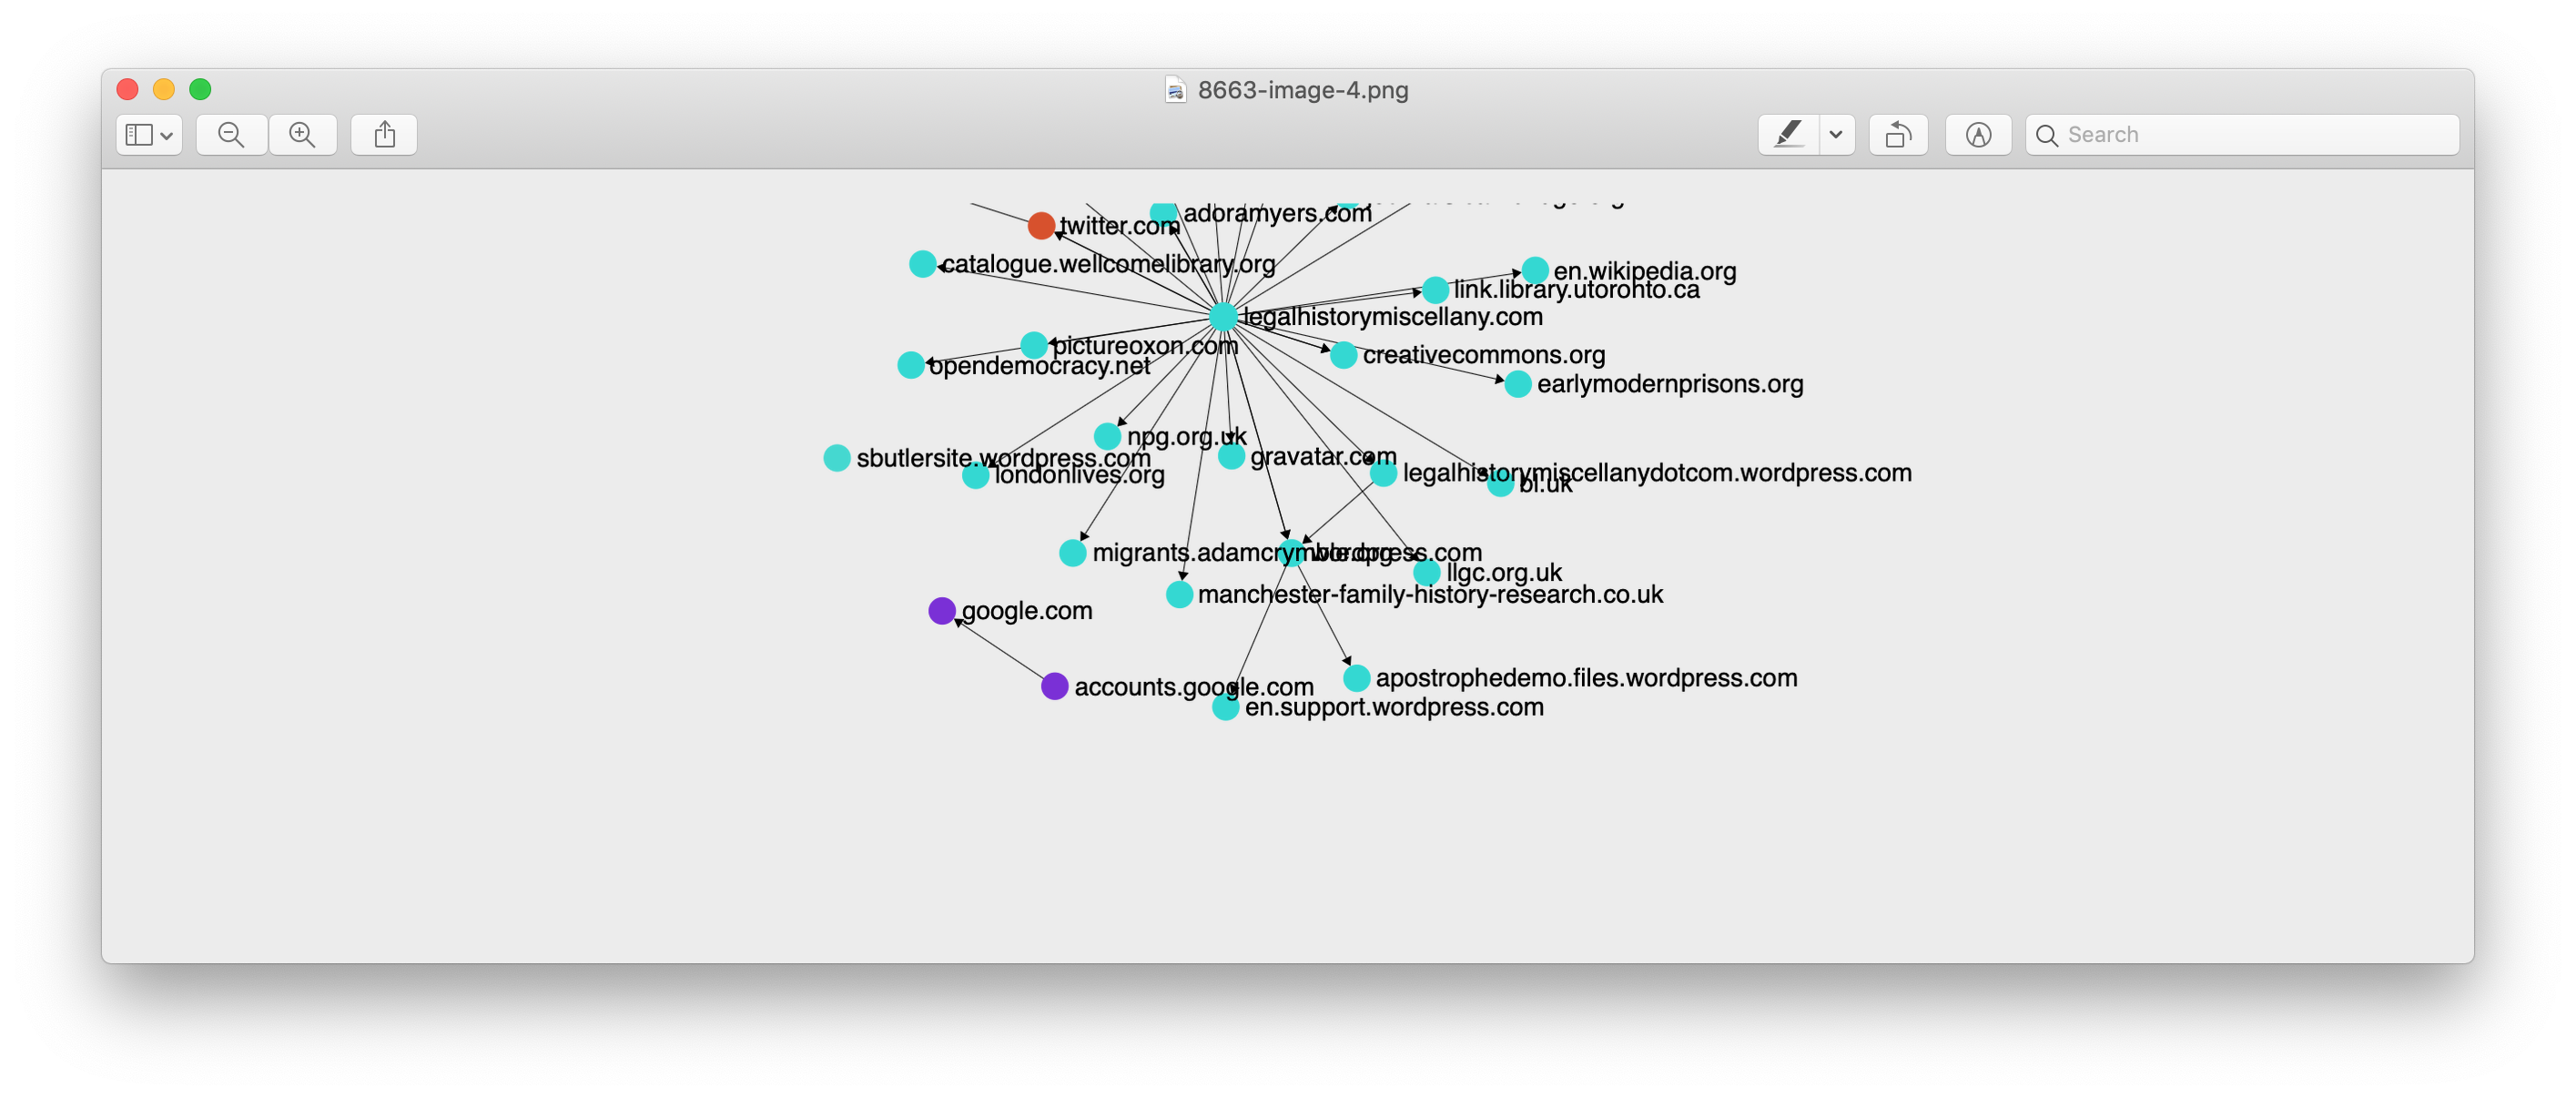
Add a button to the graph to screen capture the canvas and save it to a file
{collection_id}-image.pngGitHub issue(s):
#255
What does this Pull Request do?
Clicking the button that looks like this:
Will produce an image for a canvas like this:
and download a file called
{collection-id}-image.pngthat looks like this.And if you do some toggling and/or zooming in the screen, the changes will be preserved in the image:
How should this be tested?
Additional Notes:
There are some UI considerations here before merge I think, but overall I think this works approximately the way it should.
Interested parties
@ianmilligan1 @SamFritz @ruebot
Thanks in advance for your help with the Archives Unleashed Toolkit!