Skip to content
New issue

Have a question about this project? Sign up for a free GitHub account to open an issue and contact its maintainers and the community.

By clicking “Sign up for GitHub”, you agree to our terms of service and privacy statement. We’ll occasionally send you account related emails.

Already on GitHub? Sign in to your account

Investigate what would be needed to include crawl-sites visualization #146

Open
ruebot opened this issue Jul 3, 2018 · 28 comments

Comments

Projects
None yet
3 participants
@ruebot
Copy link
Member

commented Jul 3, 2018

See what is needed to add crawl-sites.

  • We'd probably need to convert process.py to a helper method
  • We'd probably need to convert all the js here to standalone js file like we do with graph.js
  • Need to do some timing tests for large collections vs smaller collections (does it scale)

@ruebot ruebot self-assigned this Jul 3, 2018

@ianmilligan1

This comment has been minimized.

Copy link
Member

commented Jul 3, 2018

Here's an example of the output for other following along: http://lintool.github.io/warcbase/vis/crawl-sites/.

I ran this on all the WALK collections, FWIW, and was able to do the full thing in a few minutes on a laptop if I remember correctly. Here's one of our 4-5TB ones: https://web-archive-group.github.io/WALK-CrawlVis/crawl-sites/ALBERTA_government_information_all_urls.html.

@ianmilligan1

This comment has been minimized.

Copy link
Member

commented Jul 4, 2018

FYI I dug back into our past workflow and am glad I did as it's a bit janky.

Here's the latest workflow I was using to do this.

https://github.com/web-archive-group/WALK-CrawlVis/blob/master/WORKFLOW.md

Note that the major problem is the output from the domain count is different than what process.py expects, mostly because the crawl-viz dates from when we still used Pig! Probably process.py should change to process the new format rather than me escaping random stuff using sed.

@ruebot

This comment has been minimized.

Copy link
Member Author

commented Feb 6, 2019

If we add an additional spark sub-job:

/home/nruest/bin/spark-2.3.2-bin-hadoop2.7/bin/spark-shell --master local\[2\] --driver-memory 6G --conf spark.network.timeout=10000000 --conf spark.executor.heartbeatInterval=600s --conf spark.driver.maxResultSize=4G --packages "io.archivesunleashed:aut:0.17.0"


import io.archivesunleashed._
import io.archivesunleashed.matchbox._

val r =
RecordLoader.loadArchives("/home/nruest/Projects/tmp/4811/warcs/*.gz", sc)
.keepValidPages()
.map(r => (r.getCrawlMonth,ExtractDomain(r.getUrl)))
.countItems()
.saveAsTextFile("/home/nruest/Projects/tmp/auk-issue-146")

We'll get output like this:

((201411,corcoran.gwu.edu),36852)
((201412,corcoran.gwu.edu),20232)
((201409,www.corcoran.edu),16089)
((201409,www.corcoran.org),15923)
((201512,newsite.corcoran.org),5432)
((201512,corcoran.gwu.edu),2911)
((201410,unveiled.corcoran.org),1058)
((201412,unveiled.corcoran.gwu.edu),589)
((201411,unveiled.corcoran.org),545)
((201411,next2012.corcoran.edu),487)
((201411,next.corcoran.edu),345)
((201409,legacy.corcoran.edu),329)
((201411,next.corcoran.gwu.edu),277)
((201411,savethecorcoran.org),274)
((201411,next2011.corcoran.edu),211)
((201410,accounts.google.com),192)
((201412,www.facebook.com),177)
((201411,www.youtube.com),169)
((201412,www.youtube.com),160)
((201411,next2012.corcoran.gwu.edu),146)
((201411,next2011.corcoran.gwu.edu),96)
((201410,plus.google.com),96)
((201412,unveiled.corcoran.org),93)
((201411,accounts.google.com),91)
((201412,plus.google.com),88)
((201412,accounts.google.com),88)
((201411,next2013.corcoran.edu),83)
((201608,newsite.corcoran.org),81)
((201410,www.youtube.com),80)
((201411,widget.stagram.com),44)
((201411,player.vimeo.com),42)
((201410,player.vimeo.com),36)
((201409,player.vimeo.com),26)
((201512,player.vimeo.com),23)
((201411,pixel.fetchback.com),23)
((201412,player.vimeo.com),21)
((201411,widget.websta.me),17)
((201409,www.youtube.com),14)
((201411,www.corcoran.org),12)
((201411,s.youtube.com),9)
((201410,www.corcoran.org),6)
((201410,w.soundcloud.com),5)
((201410,gen.xyz),5)
((201411,dublincore.org),5)
((201409,next.corcoran.edu),5)
((201411,ogp.me),5)
((201411,www.gwu.edu),5)
((201410,vine.co),4)
((201410,8tracks.com),4)
((201411,r9---sn-nwj7knls.googlevideo.com),4)
((201608,www.googletagmanager.com),4)
((201410,www.wishpond.com),4)
((201512,www.corcoran.org),4)
((201410,www.ustream.tv),4)
((201411,www.corcoran.edu),3)
((201705,s.w.org),3)
((201411,www.google.com),3)
((201411,r6---sn-nwj7kner.googlevideo.com),3)
((201411,purl.org),3)
((201409,cm.g.doubleclick.net),3)
((201411,www.w3.org),3)
((201411,r18---sn-nwj7kned.googlevideo.com),3)
((201411,platform.twitter.com),3)
((201608,f.vimeocdn.com),3)
((201412,0.gravatar.com),3)
((201411,0.gravatar.com),3)
((201705,next.corcoran.gwu.edu),3)
((201411,r17---sn-nwj7knl7.googlevideo.com),2)
((201409,twitter.com),2)
((201512,cm.g.doubleclick.net),2)
((201411,www.wishpond.com),2)
((201411,r12---sn-nwj7knls.googlevideo.com),2)
((201411,www2.gwu.edu),2)
((201512,www.googletagmanager.com),2)
((201410,corcoran.gwu.edu),2)
((201705,wordpress.org),2)
((201409,server.iad.liveperson.net),2)
((201411,www.ustream.tv),2)
((201411,r14---sn-nwj7kned.googlevideo.com),2)
((201410,www.corcoran.edu),2)
((201412,www.wishpond.com),2)
((201411,plus.googleapis.com),2)
((201410,storify.com),2)
((201411,r13---sn-nwj7knls.googlevideo.com),2)
((201411,vine.co),2)
((201411,r6---sn-nwj7knek.googlevideo.com),2)
((201411,r5---sn-nwj7kner.googlevideo.com),2)
((201410,instagram.com),2)
((201412,r9---sn-nwj7knls.googlevideo.com),2)
((201412,www.ustream.tv),2)
((201411,r10---sn-nwj7knls.googlevideo.com),2)
((201412,8tracks.com),2)
((201411,r4---sn-nwj7kned.googlevideo.com),2)
((201411,r20---sn-nwj7knl7.googlevideo.com),2)
((201411,r10---sn-nwj7kned.googlevideo.com),2)
((201411,r9---sn-nwj7kned.googlevideo.com),2)
((201411,r1---sn-nwj7kned.googlevideo.com),2)
((201412,vine.co),2)
((201512,next.corcoran.edu),2)
((201411,r6---sn-nwj7kne6.googlevideo.com),2)
((201411,r13---sn-nwj7kner.googlevideo.com),2)
((201411,8tracks.com),2)
((201409,collection.corcoran.org),2)
((201411,r17---sn-nwj7kner.googlevideo.com),2)
((201409,www.googletagmanager.com),2)
((201411,plus.google.com),2)
((201411,r4---sn-o097znle.googlevideo.com),2)
((201411,r20---sn-nwj7knls.googlevideo.com),2)
((201411,xmlns.com),2)
((201411,r2---sn-nwj7kned.googlevideo.com),2)
((201410,platform.twitter.com),1)
((201411,r14---sn-nwj7knek.googlevideo.com),1)
((201411,storify.com),1)
((201411,youtu.be),1)
((201412,r9---sn-nwj7kned.googlevideo.com),1)
((201705,fonts.googleapis.com),1)
((201512,next.corcoran.gwu.edu),1)
((201512,www.w3.org),1)
((201409,www.liveperson.com),1)
((201412,r6---sn-nwj7knek.googlevideo.com),1)
((201412,r12---sn-nwj7knls.googlevideo.com),1)
((201412,r9---sn-nwj7knek.googlevideo.com),1)
((201411,f.vimeocdn.com),1)
((201512,www.facebook.com),1)
((201411,r17---sn-nwj7kne6.googlevideo.com),1)
((201409,corcoran.edu),1)
((201412,r13---sn-nwj7knls.googlevideo.com),1)
((201409,pixel.fetchback.com),1)
((201411,redirector.googlevideo.com),1)
((201409,www.w3.org),1)
((201411,ct1.addthis.com),1)
((201411,get.adobe.com),1)
((201411,s.ytimg.com),1)
((201412,ogp.me),1)
((201411,r3---sn-nwj7knls.googlevideo.com),1)
((201411,gwc.lphbs.com),1)
((201512,www.gwu.edu),1)
((201412,r10---sn-nwj7kned.googlevideo.com),1)
((201411,apis.google.com),1)
((201412,r1---sn-nwj7kned.googlevideo.com),1)
((201411,r1---sn-nwj7kner.googlevideo.com),1)
((201411,i.ytimg.com),1)
((201411,w.soundcloud.com),1)
((201411,1.gravatar.com),1)
((201608,pixel.admedia.com),1)
((201411,r18---sn-nwj7kner.googlevideo.com),1)
((201411,r5---sn-nwj7knl7.googlevideo.com),1)
((201412,storify.com),1)
((201411,r5---sn-nwj7knls.googlevideo.com),1)
((201411,m.youtube.com),1)
((201412,docs.google.com),1)
((201512,ogp.me),1)
((201705,www.hugo-creative.com),1)
((201412,1.gravatar.com),1)
((201412,r20---sn-nwj7knl7.googlevideo.com),1)
((201411,r15---sn-nwj7knek.googlevideo.com),1)
((201512,www.sheepandwool.org),1)
((201411,r1---sn-nwj7kne6.googlevideo.com),1)
((201409,ce.corcoran.edu),1)
((201411,r9---sn-nwj7knek.googlevideo.com),1)
((201409,www.uhs.uga.edu),1)
((201512,www.rawartists.org),1)
((201411,r20---sn-nwj7kner.googlevideo.com),1)
((201412,instagram.com),1)
((201409,chat.zoho.com),1)
((201512,dublincore.org),1)
((201412,r5---sn-nwj7kner.googlevideo.com),1)
((201411,r5---sn-nwj7knek.googlevideo.com),1)
((201412,r1---sn-nwj7kne6.googlevideo.com),1)
((201412,r13---sn-nwj7kner.googlevideo.com),1)
((201512,docs.google.com),1)
((201411,docs.google.com),1)
((201512,portfolios.corcoran.gwu.edu),1)
((201608,fpdl.vimeocdn.com),1)
((201412,w.soundcloud.com),1)
((201411,instagram.com),1)
((201512,sheepandwool.org),1)
((201411,next2013.corcoran.gwu.edu),1)
((201409,tcc.noellevitz.com),1)
((201412,r2---sn-nwj7kned.googlevideo.com),1)
((201512,www.corcoran.edu),1)
((201412,r14---sn-nwj7kned.googlevideo.com),1)
((201411,r7---sn-nwj7km7e.c.youtube.com),1)
((201412,r6---sn-nwj7kner.googlevideo.com),1)
((201608,player.vimeo.com),1)
((201411,web.resource.org),1)

Then we'll probably need to adapt process.py into a helper method to create the csv file for the visualization. This would be on the fly, and probably slow. So, maybe we should create another job, or add to the clean-up job to create the csv file in the background.

After that, it'd just be following the path of the Sigmajs visualization for this implementation.

@ianmilligan1

This comment has been minimized.

Copy link
Member

commented Feb 6, 2019

This sounds promising! I'd defer to you on the implementation, but creating this file and then possibly adding it to the clean-up job is a good route forward?

ruebot added a commit that referenced this issue Feb 6, 2019

Setup additional Spark sub-job for #146.
- Adds additional Spark sub-job to extract info for crawl-viz
- Pre-processes crawl-viz output
- This is ugly
@ruebot

This comment has been minimized.

Copy link
Member Author

commented Feb 6, 2019

Easy part done. Now I have to port process.py over to Ruby, and make sure it scales. Then implement the actual visualization.

@ruebot

This comment has been minimized.

Copy link
Member Author

commented Feb 16, 2019

According to this, when we load in a csv via d3.csv() -- like we do here -- the function only takes in a path, not a URL. So we also need to update that js code to use at least d3 v4.

@ruebot

This comment has been minimized.

Copy link
Member Author

commented May 2, 2019

To get something out of the door here, and make sure we can work with existing data, what if we took what powers the top 10 domains table, and make a column chart out of that? That should be pretty straightforward with Chartkick.

@ruebot

This comment has been minimized.

Copy link
Member Author

commented May 2, 2019

Then close the door for now on the legacy bar chart since we'd have to create a new Spark job, and update the legacy d3.js work.

If there's a lot of demand for this data from Spark in the future from users, we can add the data, and possibly integrate something like this in the user interface, or maybe the notebooks.

@ianmilligan1

This comment has been minimized.

Copy link
Member

commented May 2, 2019

That sounds like a great idea!

And yeah, maybe make it a query point in the future to see if people would really like this. We could consider changing the domain script to generate not just absolute domain frequency but domain frequency by year (that would be straightforward), and then rig something up in the Jupyter notebook.

@ruebot

This comment has been minimized.

Copy link
Member Author

commented May 2, 2019

We could consider changing the domain script to generate not just absolute domain frequency but domain frequency by year

👍

@ianmilligan1

This comment has been minimized.

Copy link
Member

commented May 2, 2019

Which yeah, as noted in your comment above, would be a simple tweak - just changing this line to (even simpler) .map(r => (r.getCrawlMonth, r.getDomain)).

Maybe that's worth doing anyways, which could give the domain notebook some heavier lifting to do – and in any case, make the domain derivative more useful? It'd get at the spirit of this issue, I think.

@ruebot

This comment has been minimized.

Copy link
Member Author

commented May 2, 2019

Yeah, it'd definitely get to the issue, but my biggest worry with any changes to it is backwards compatibility on the 172T we've already analyzed. We'd probably just have to wrap things in a method that reads the first line of the derivative file to see if there is a date or not. If there is, continue with any we do with it. If not, break.

If we're cool with that, I can update the Spark job in the work I'll do with Chartkick on this issue.

@ianmilligan1

This comment has been minimized.

Copy link
Member

commented May 2, 2019

Aye – that is persnickety, on both the AUK and Jupyter fronts (more the former than the latter, I think).

Would Chartkick read the month/domain frequency data easily? Or would it work better with straightforward domain frequency count as is? I'm happy for you to make the final call if this is worth the effort or not, as you have a far better sense than I do.

@ruebot

This comment has been minimized.

Copy link
Member Author

commented May 2, 2019

Would Chartkick read the month/domain frequency data easily?

To explicitly mimic the d3 chart @lintool did, Not that I can see. Chartkick looks to be really great for charts with straightforward data (with my brief experience with it).

Or would it work better with straightforward domain frequency count as is?

As is would be pretty easy, and give a much better look at the data than a table imo. Better? Not sure. It'd be a good question to pose to users sometime.

@ruebot

This comment has been minimized.

Copy link
Member Author

commented May 2, 2019

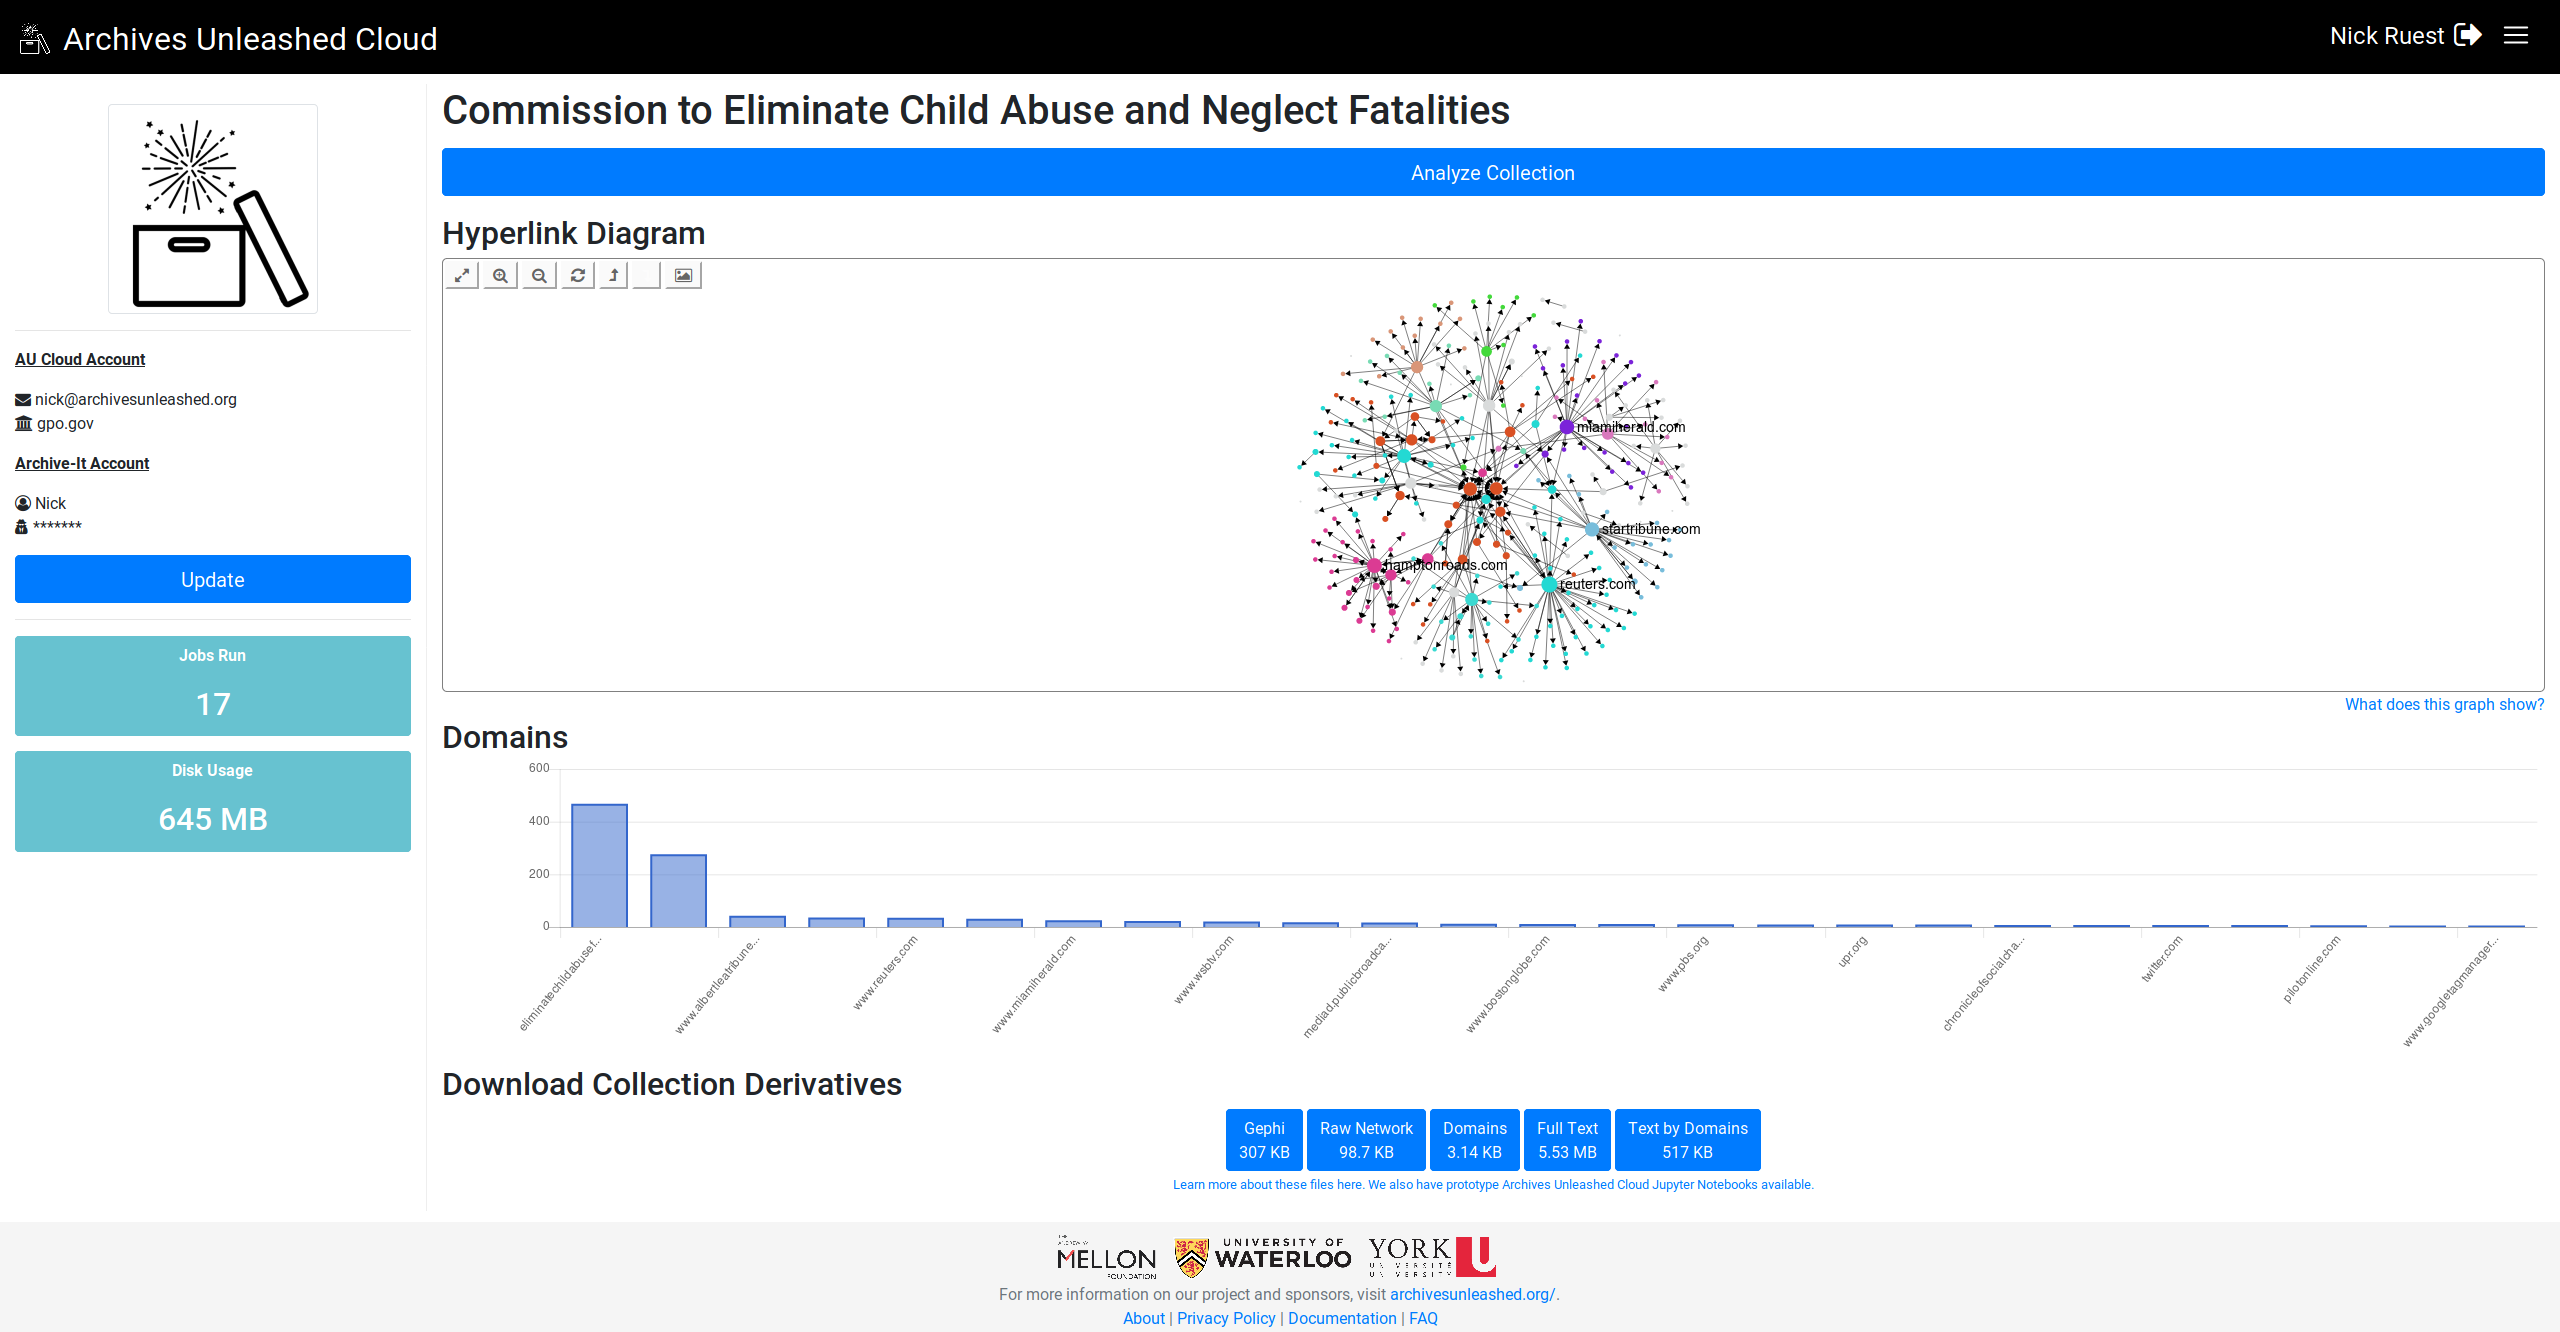
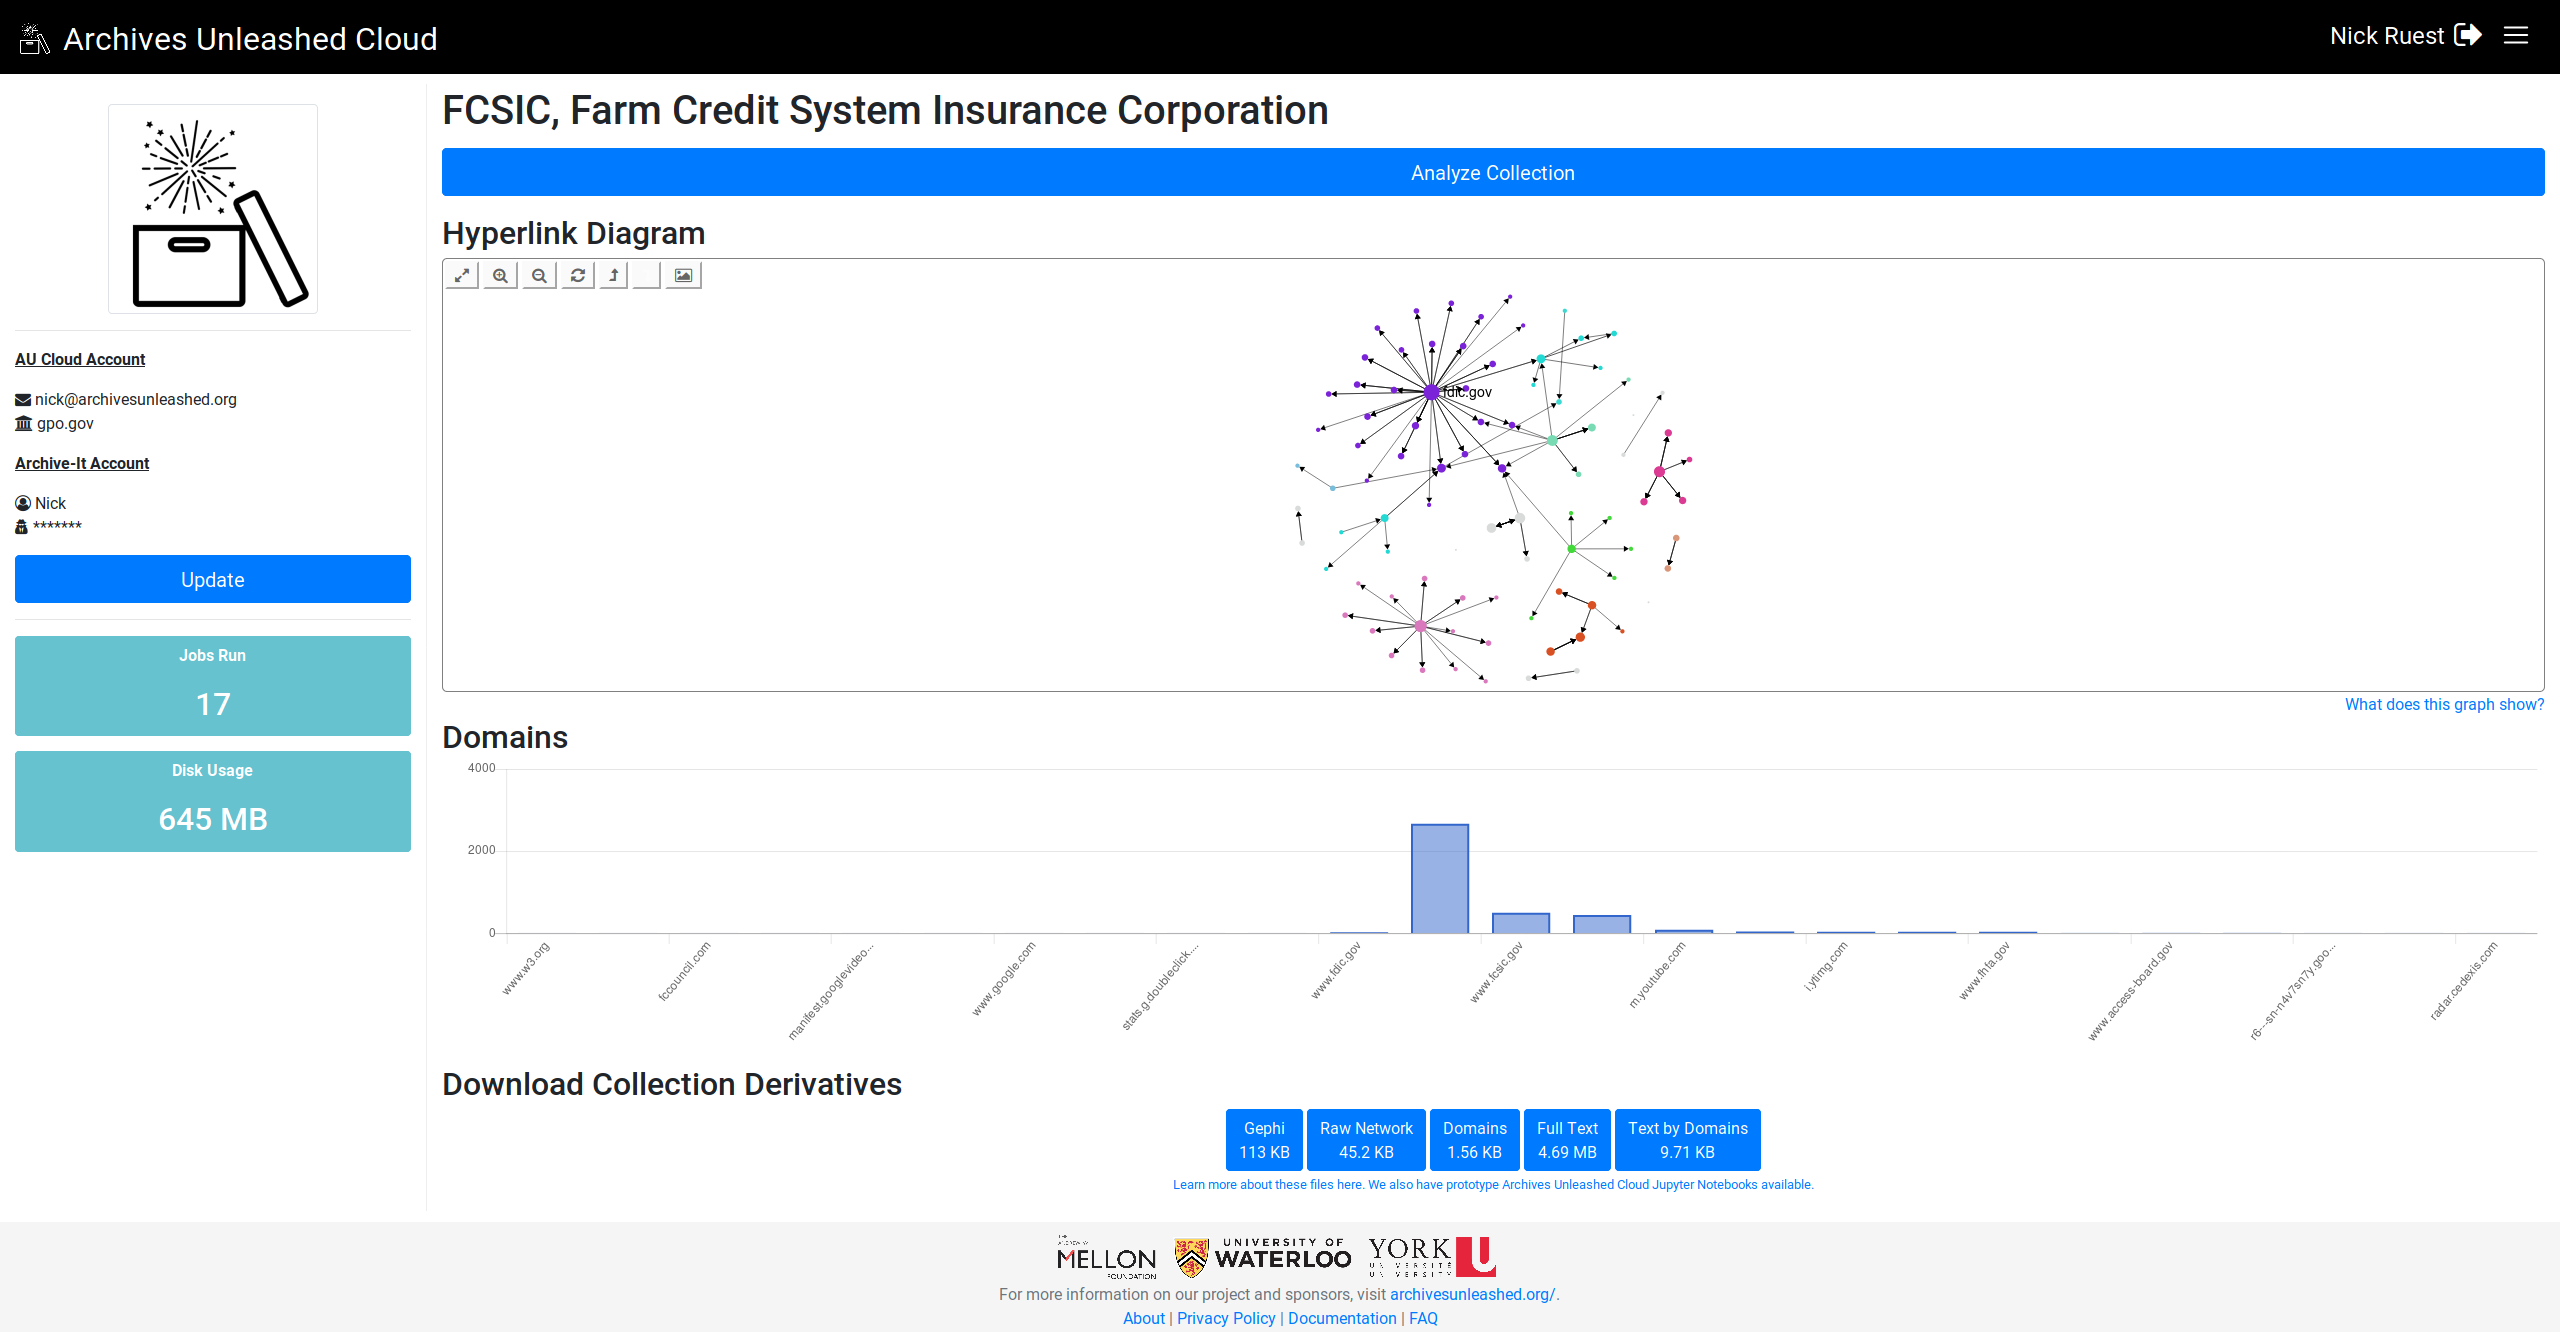
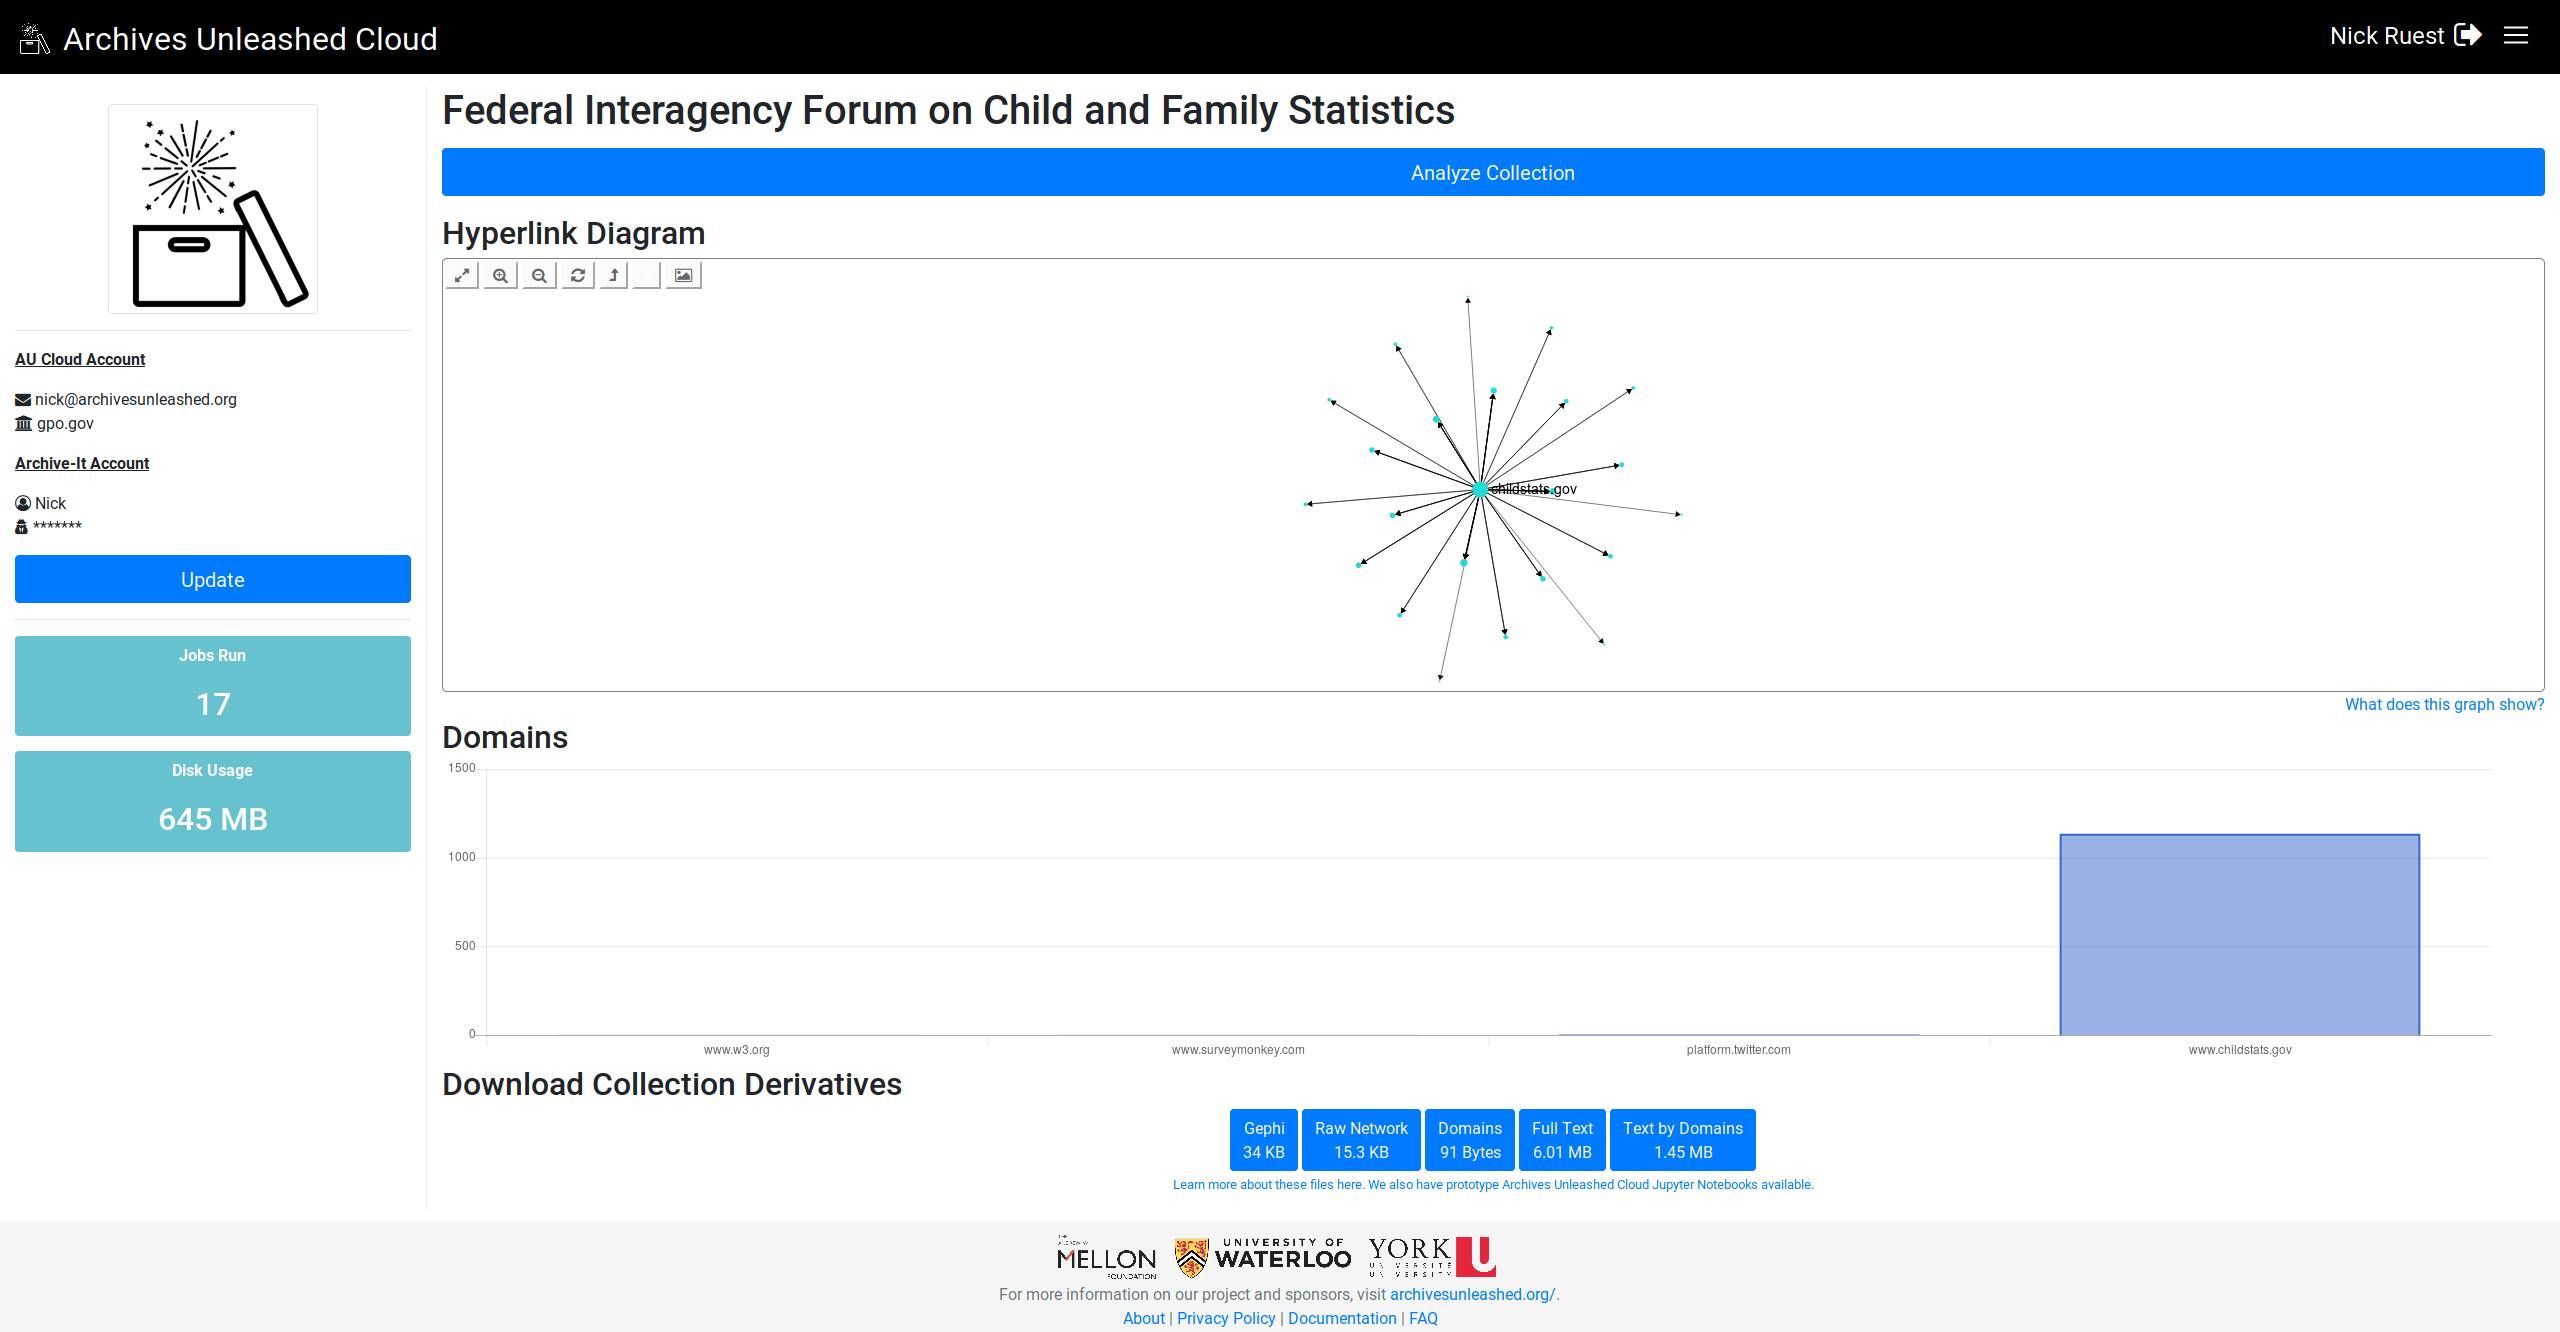
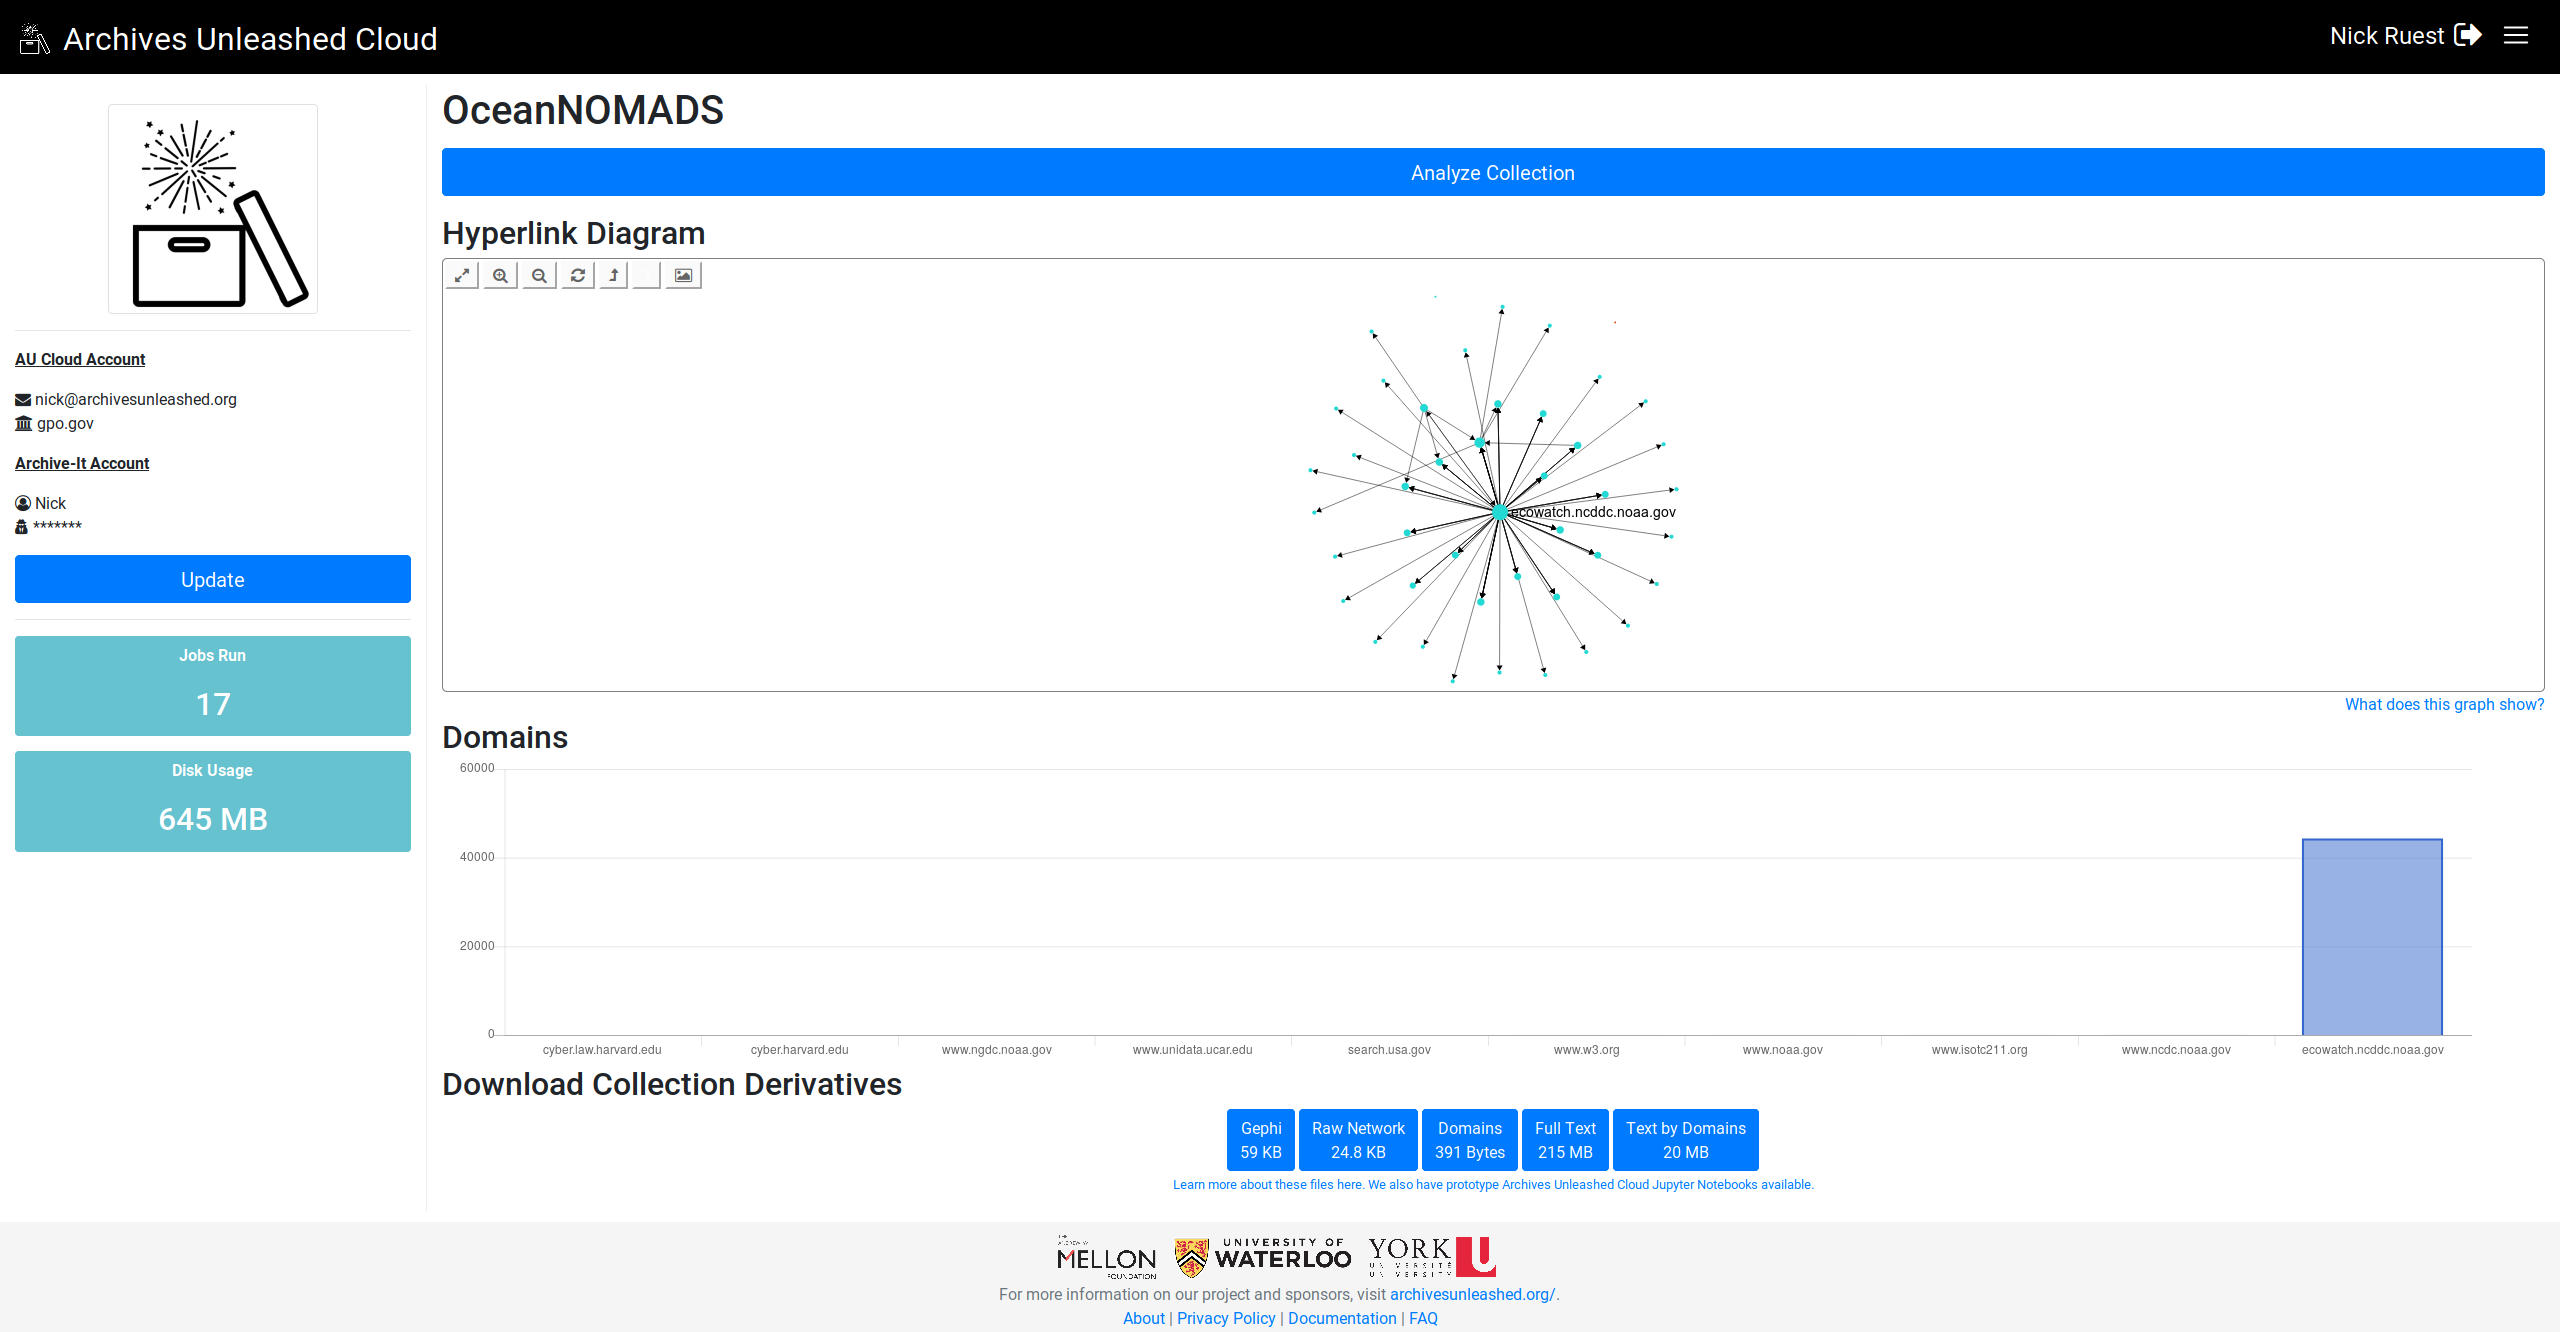
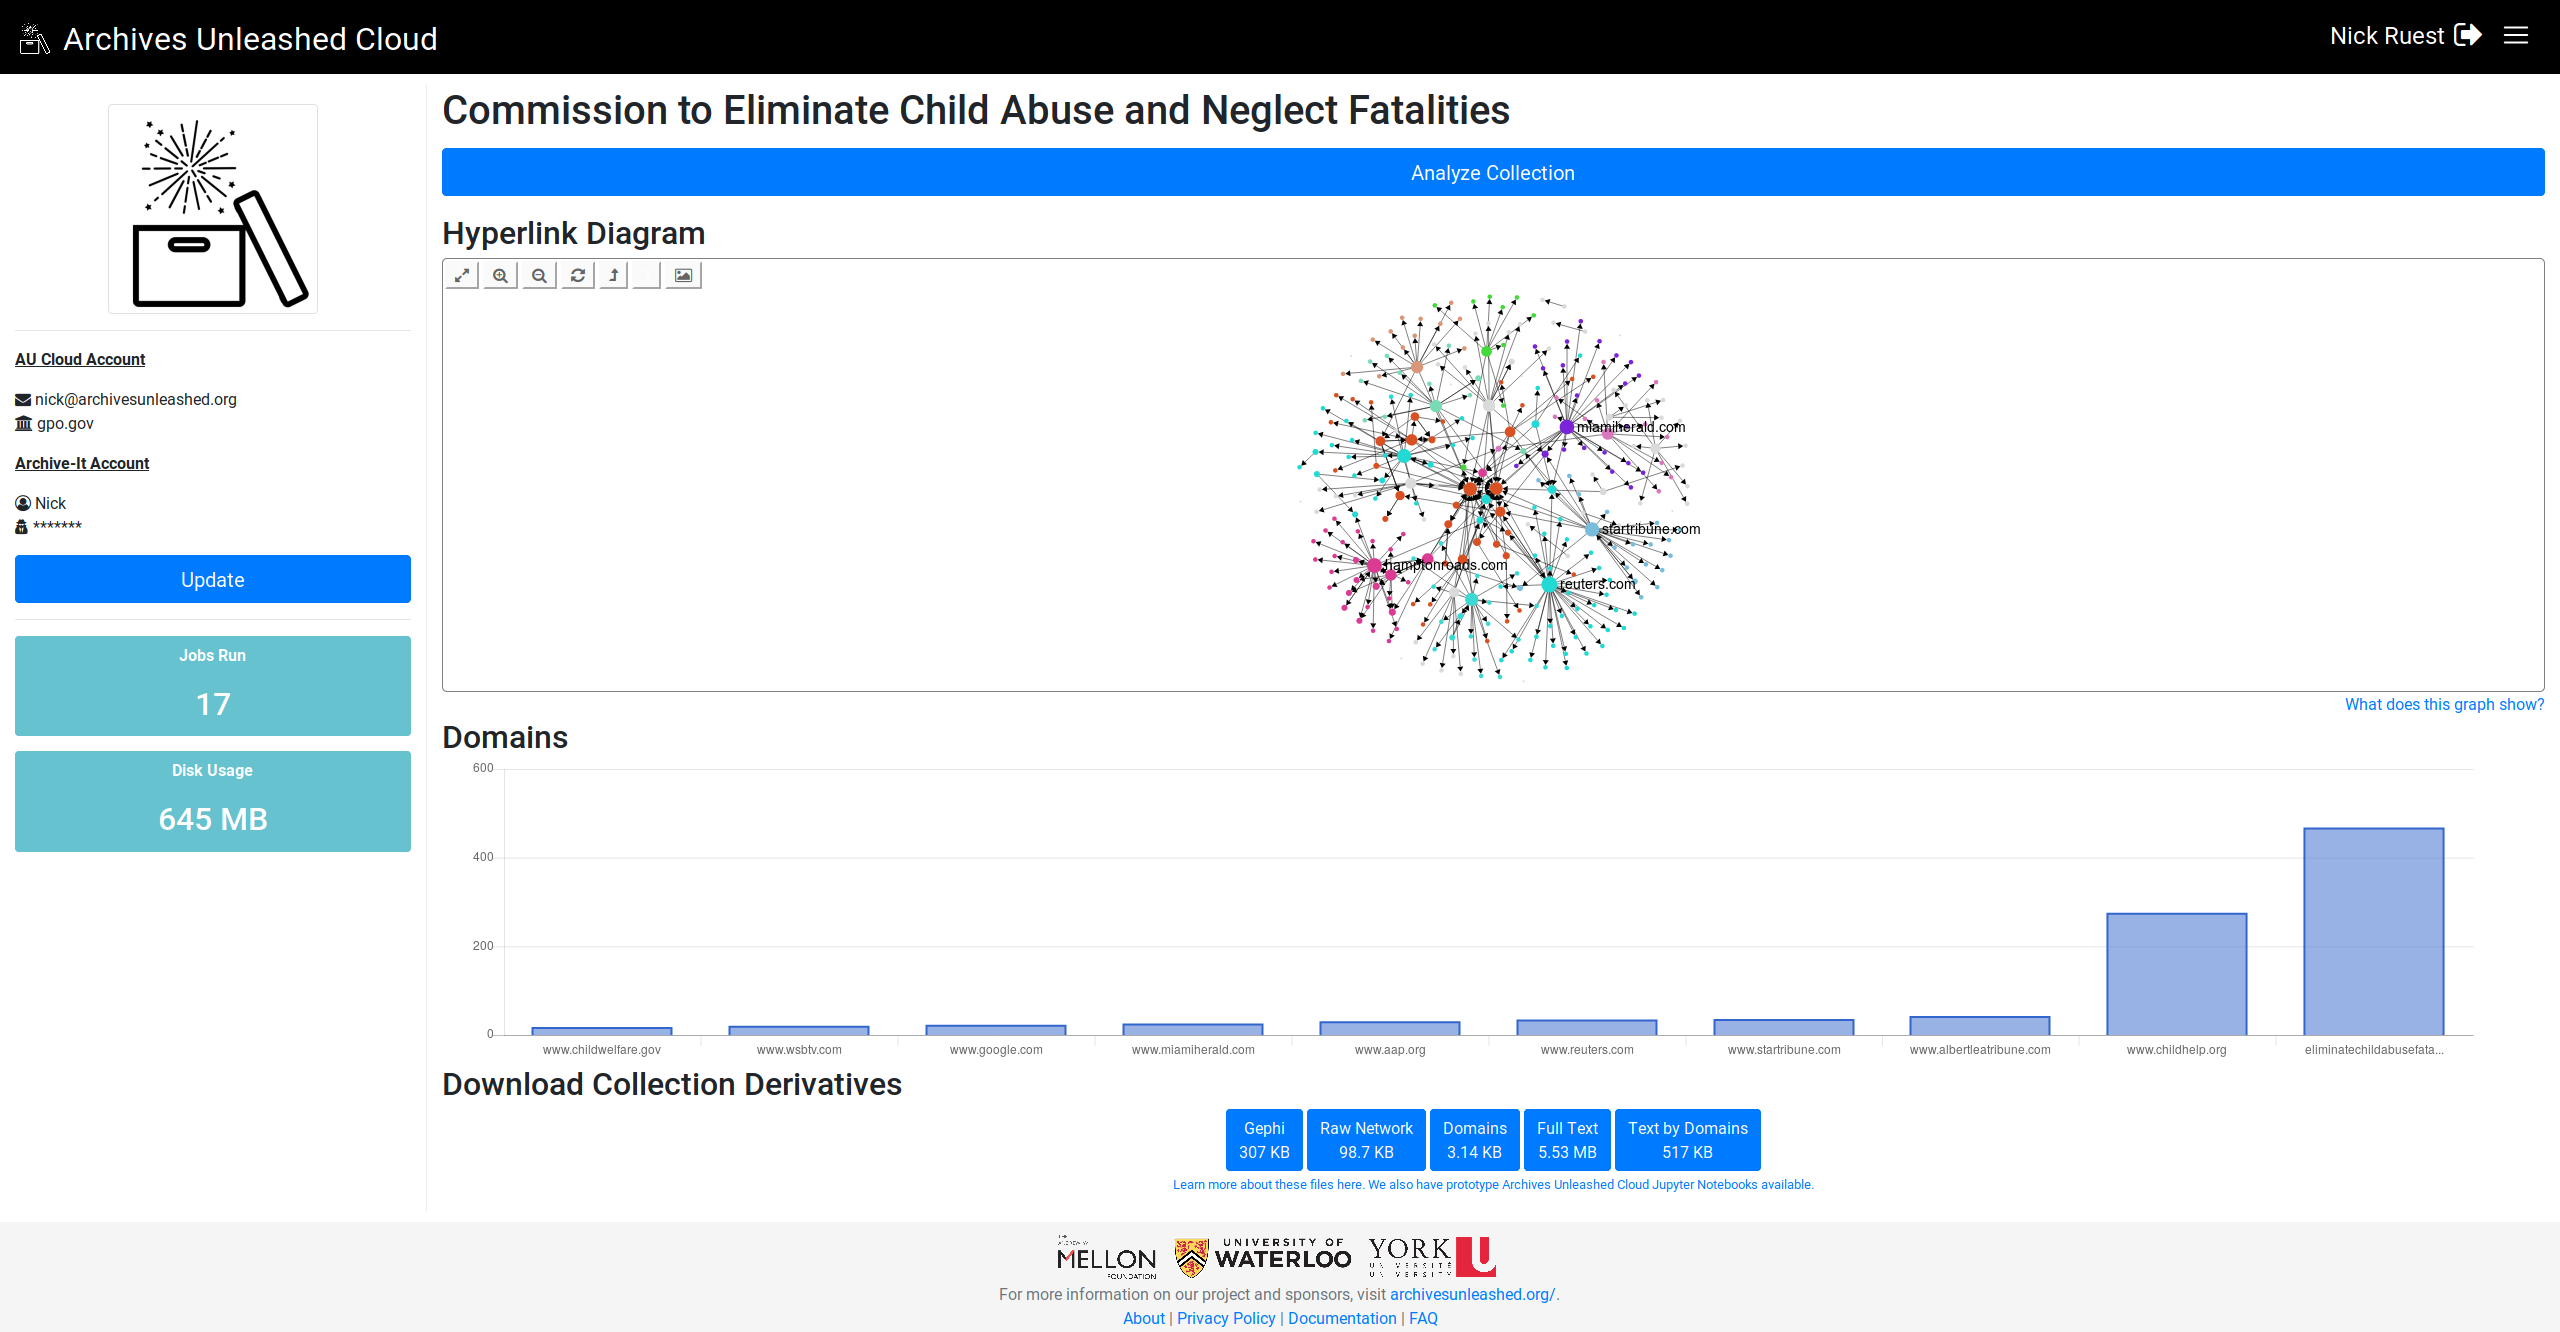
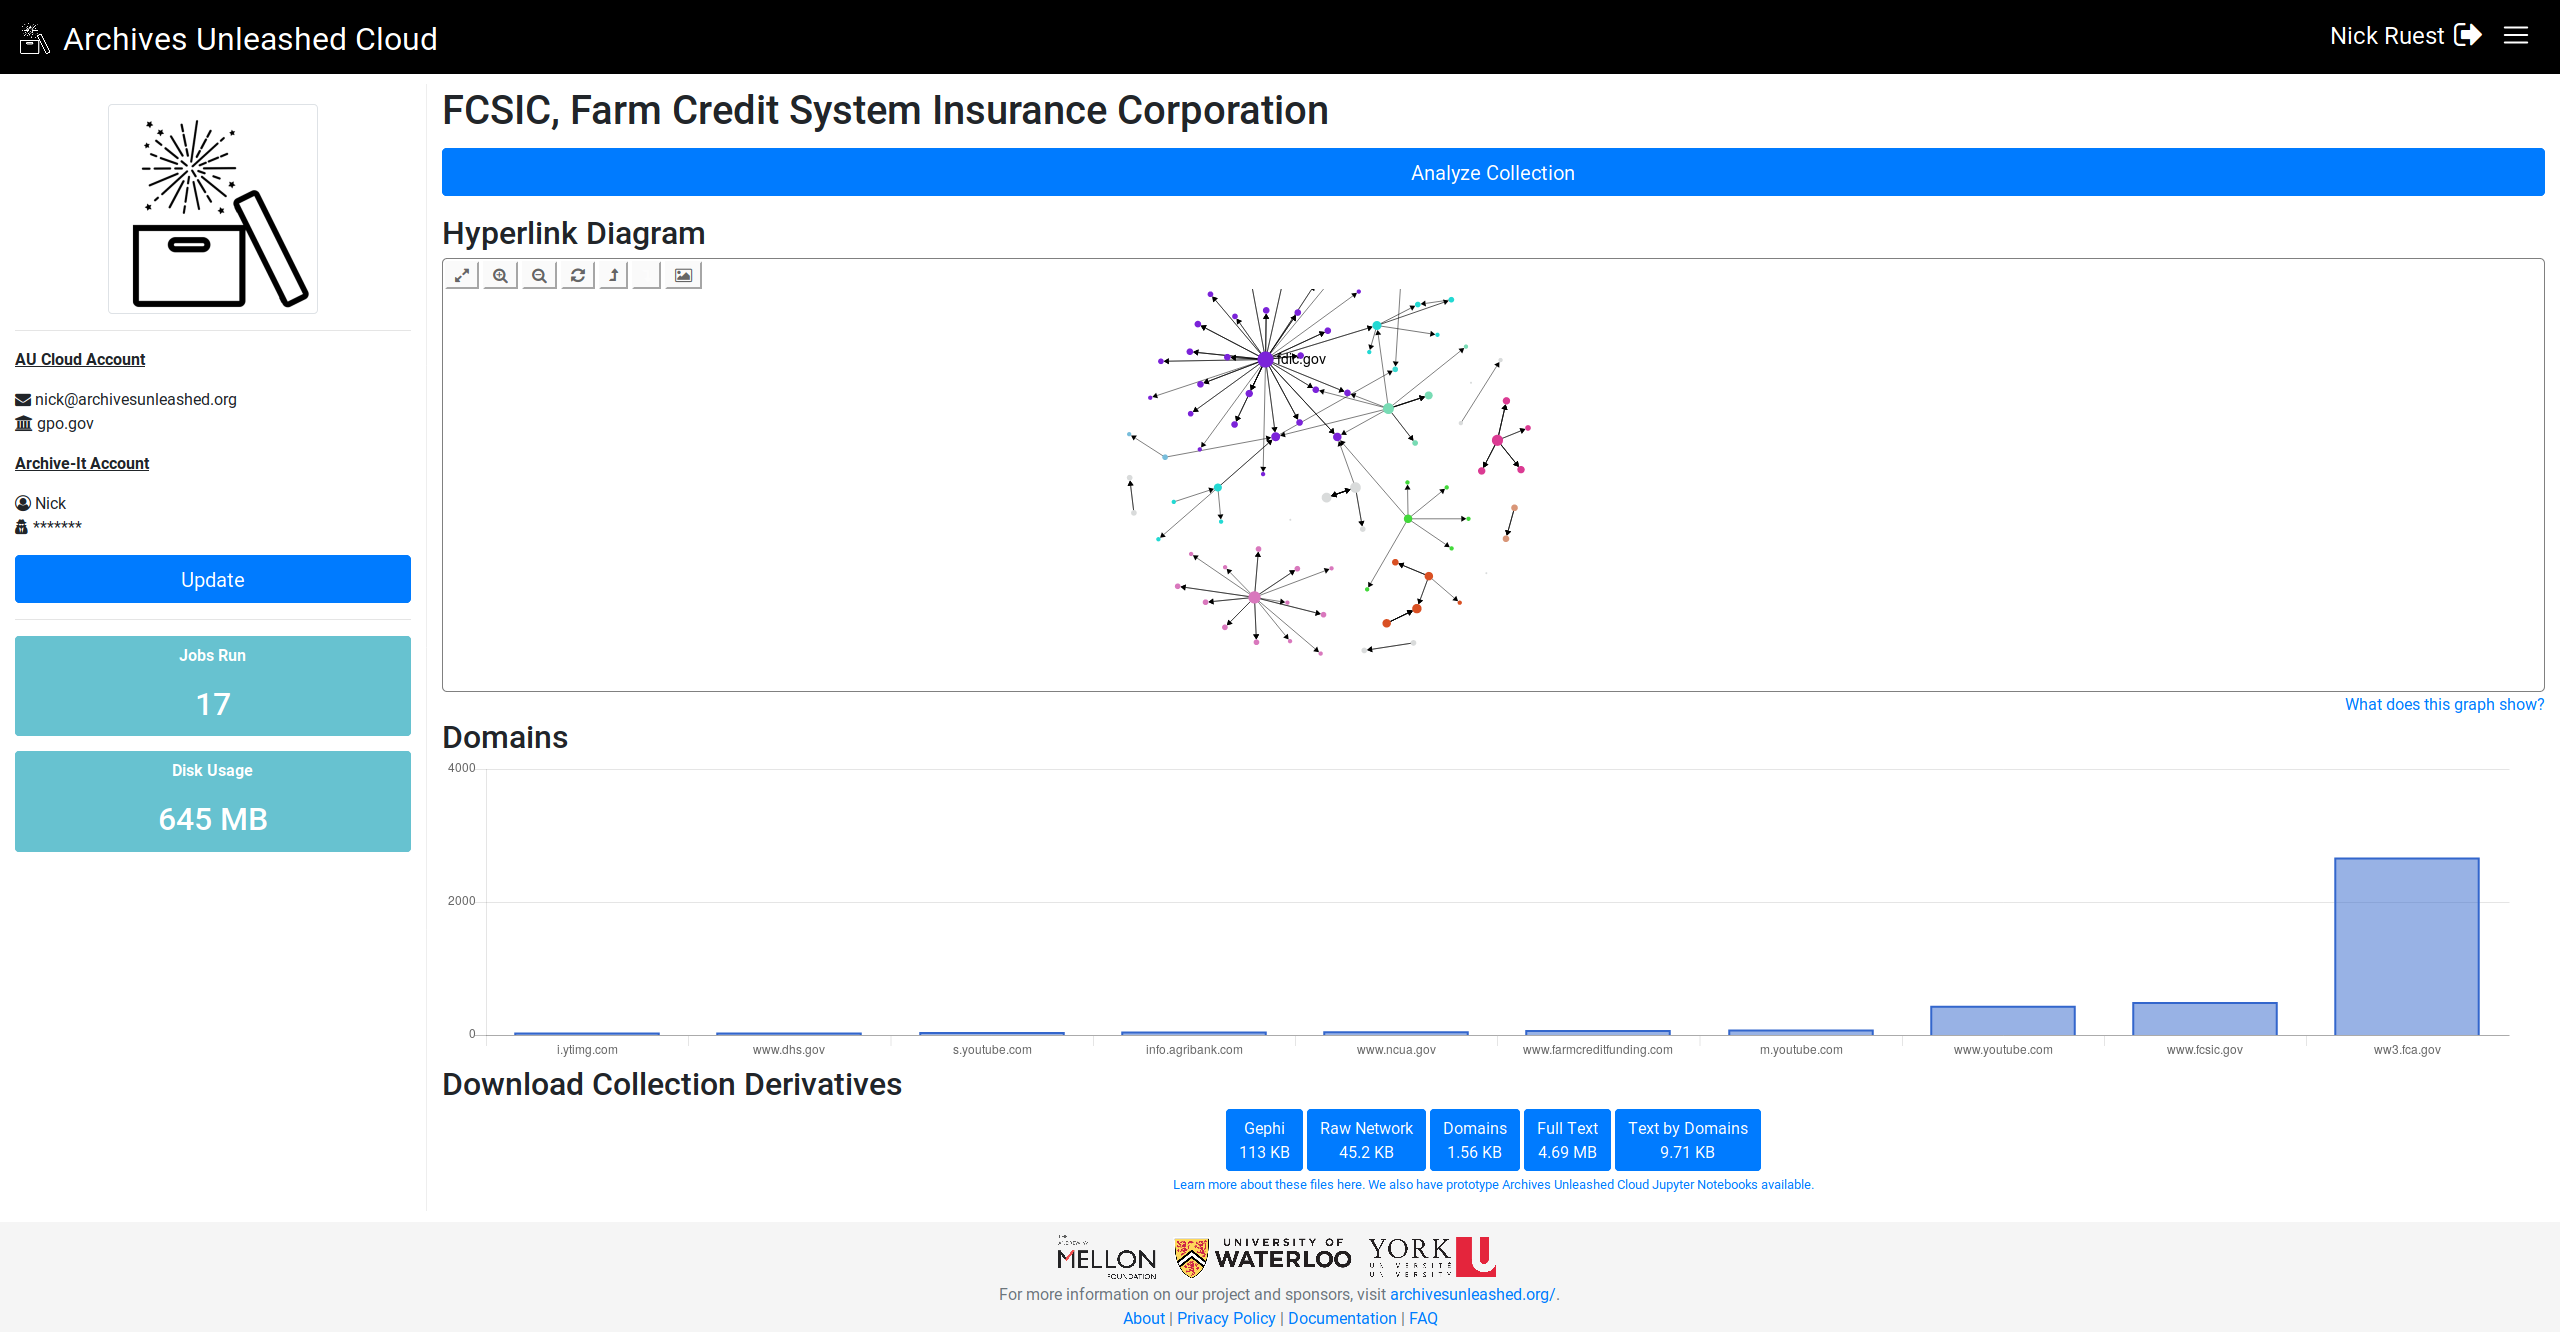
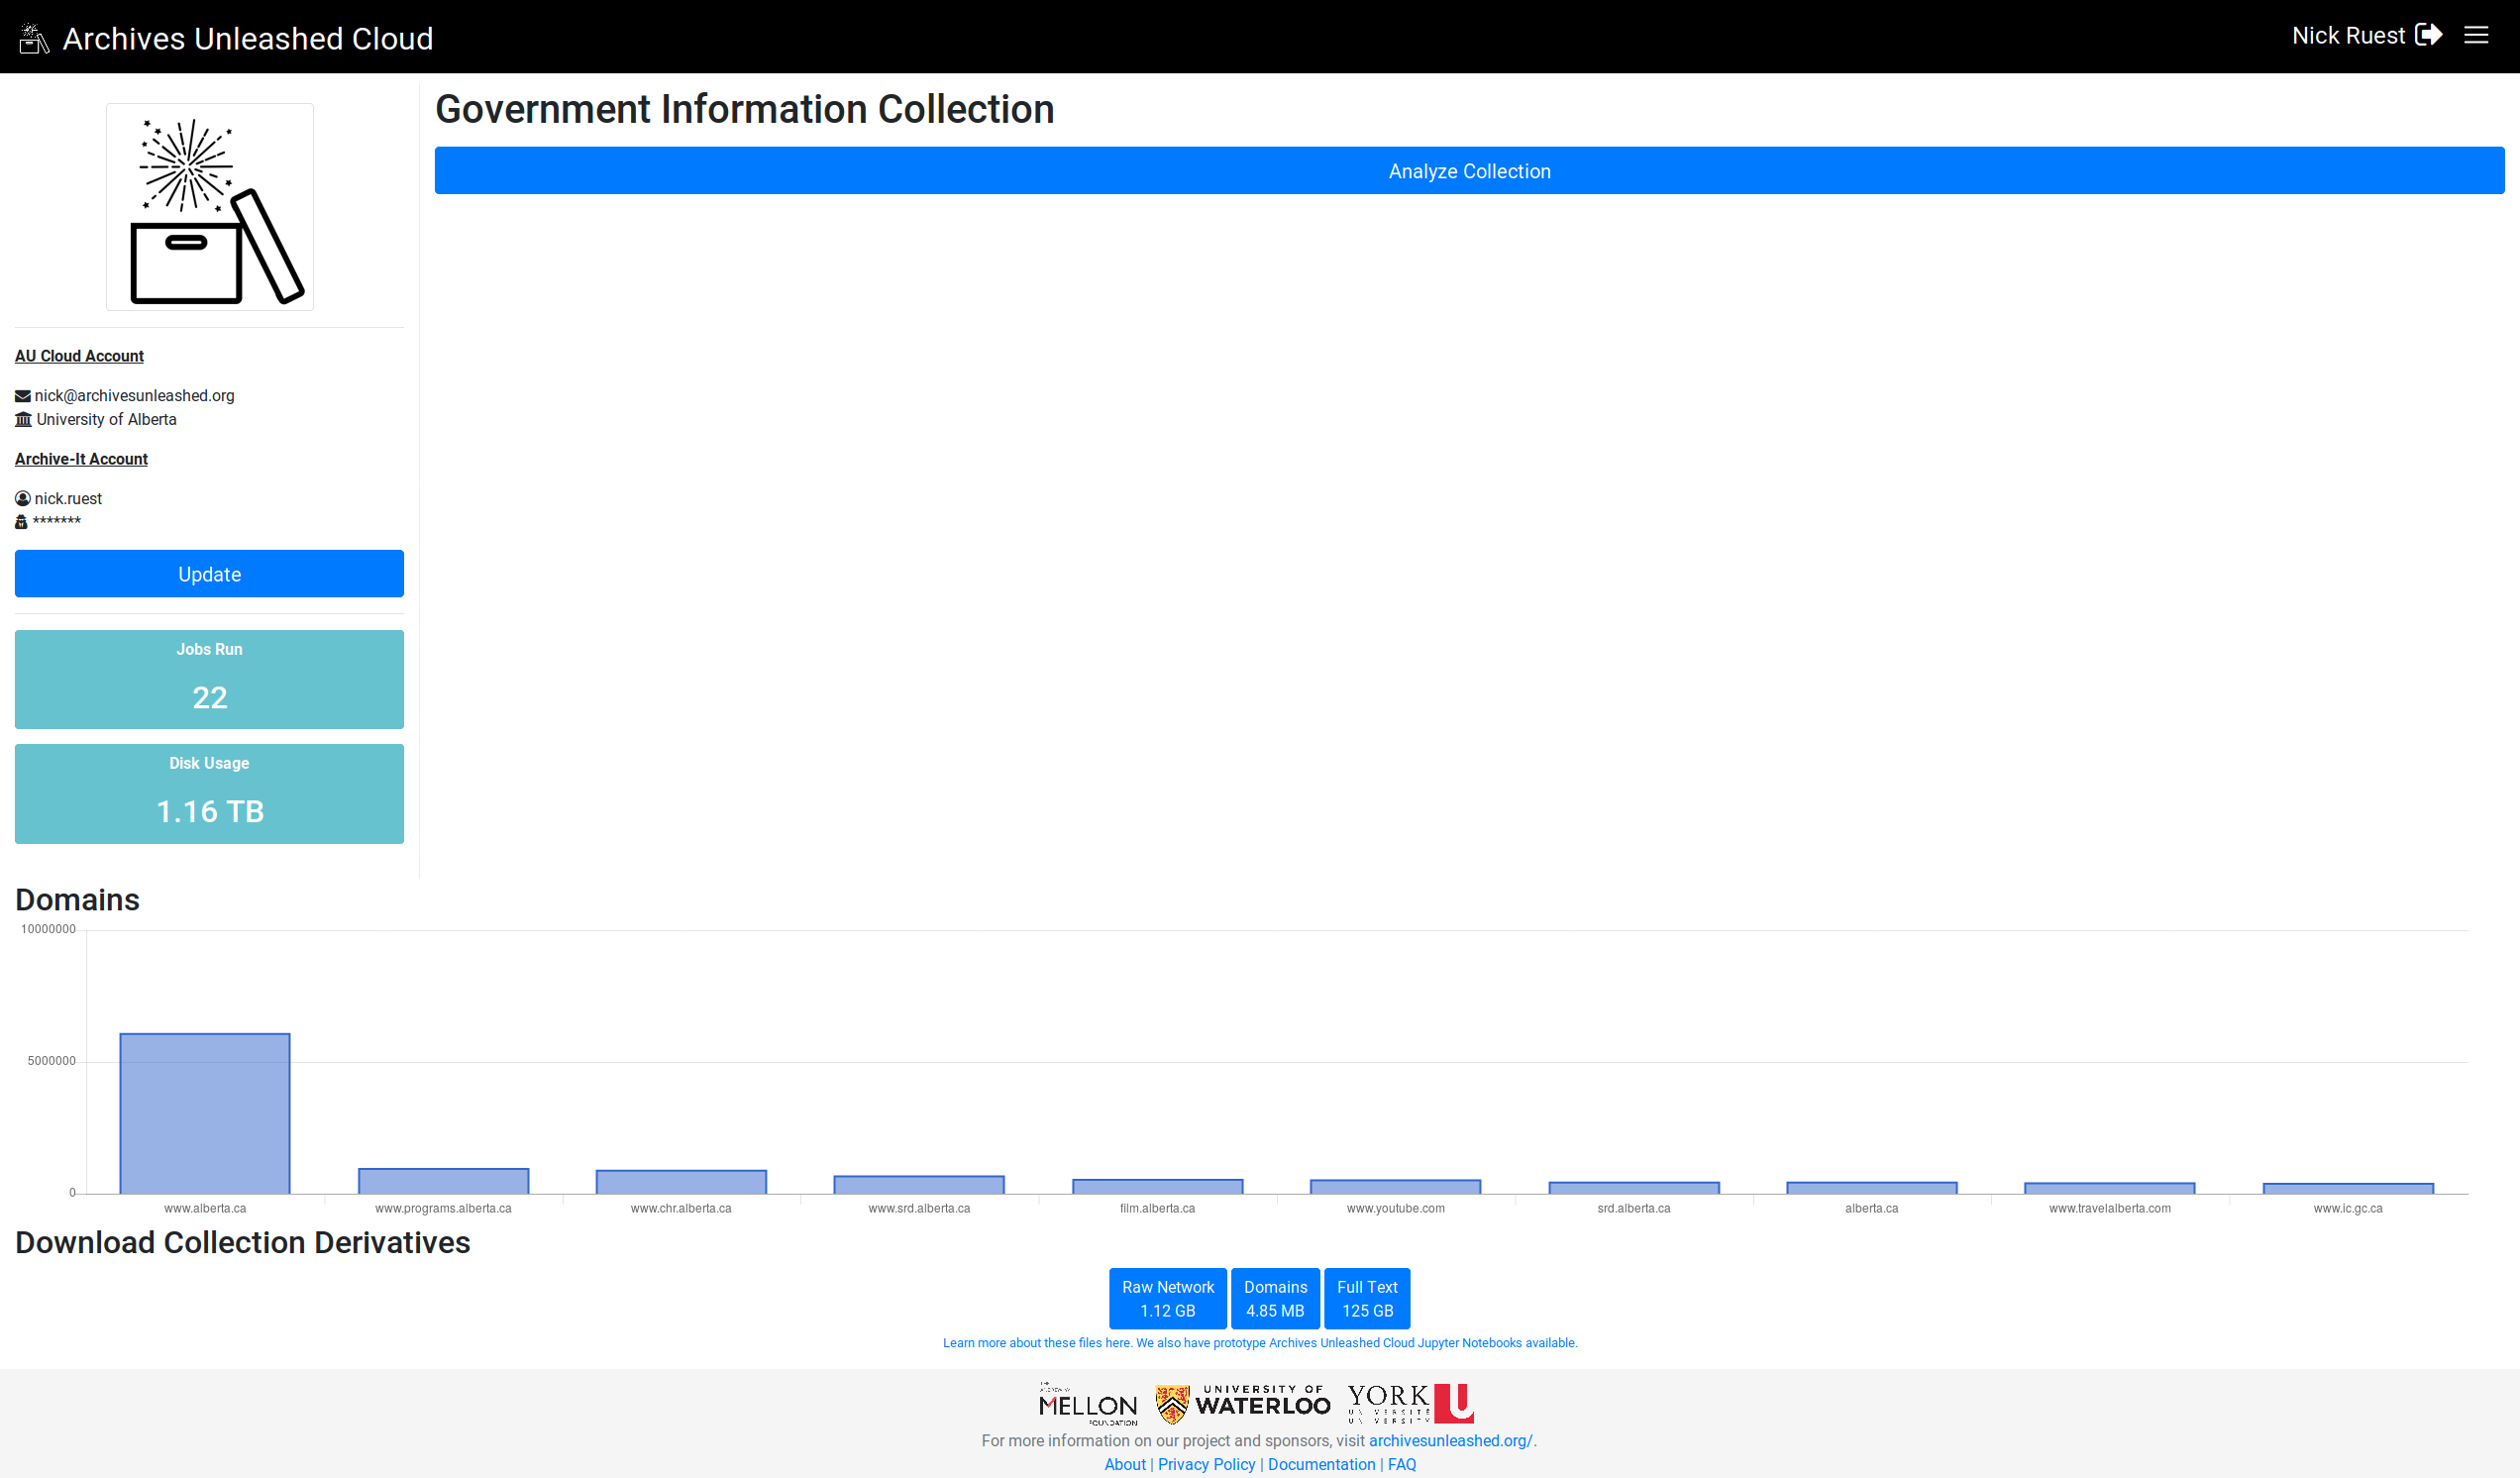
@ianmilligan1 @SamFritz @edsu (since this was related to the datathon feedback), let me know what you think (I'm pulling the top 25 domains if they're there):

Screenshot_2019-05-02 Commission to Eliminate Child Abuse and Neglect Fatalities Archives Unleashed
Screenshot_2019-05-02 FCSIC, Farm Credit System Insurance Corporation Archives Unleashed
Screenshot_2019-05-02 Native American Heritage Month Archives Unleashed
Screenshot_2019-05-02 Our Documents Archives Unleashed
Screenshot_2019-05-02 USDA - ARS Project Annual Reports from National Program 306 Archives Unleashed

@ianmilligan1

This comment has been minimized.

Copy link
Member

commented May 2, 2019

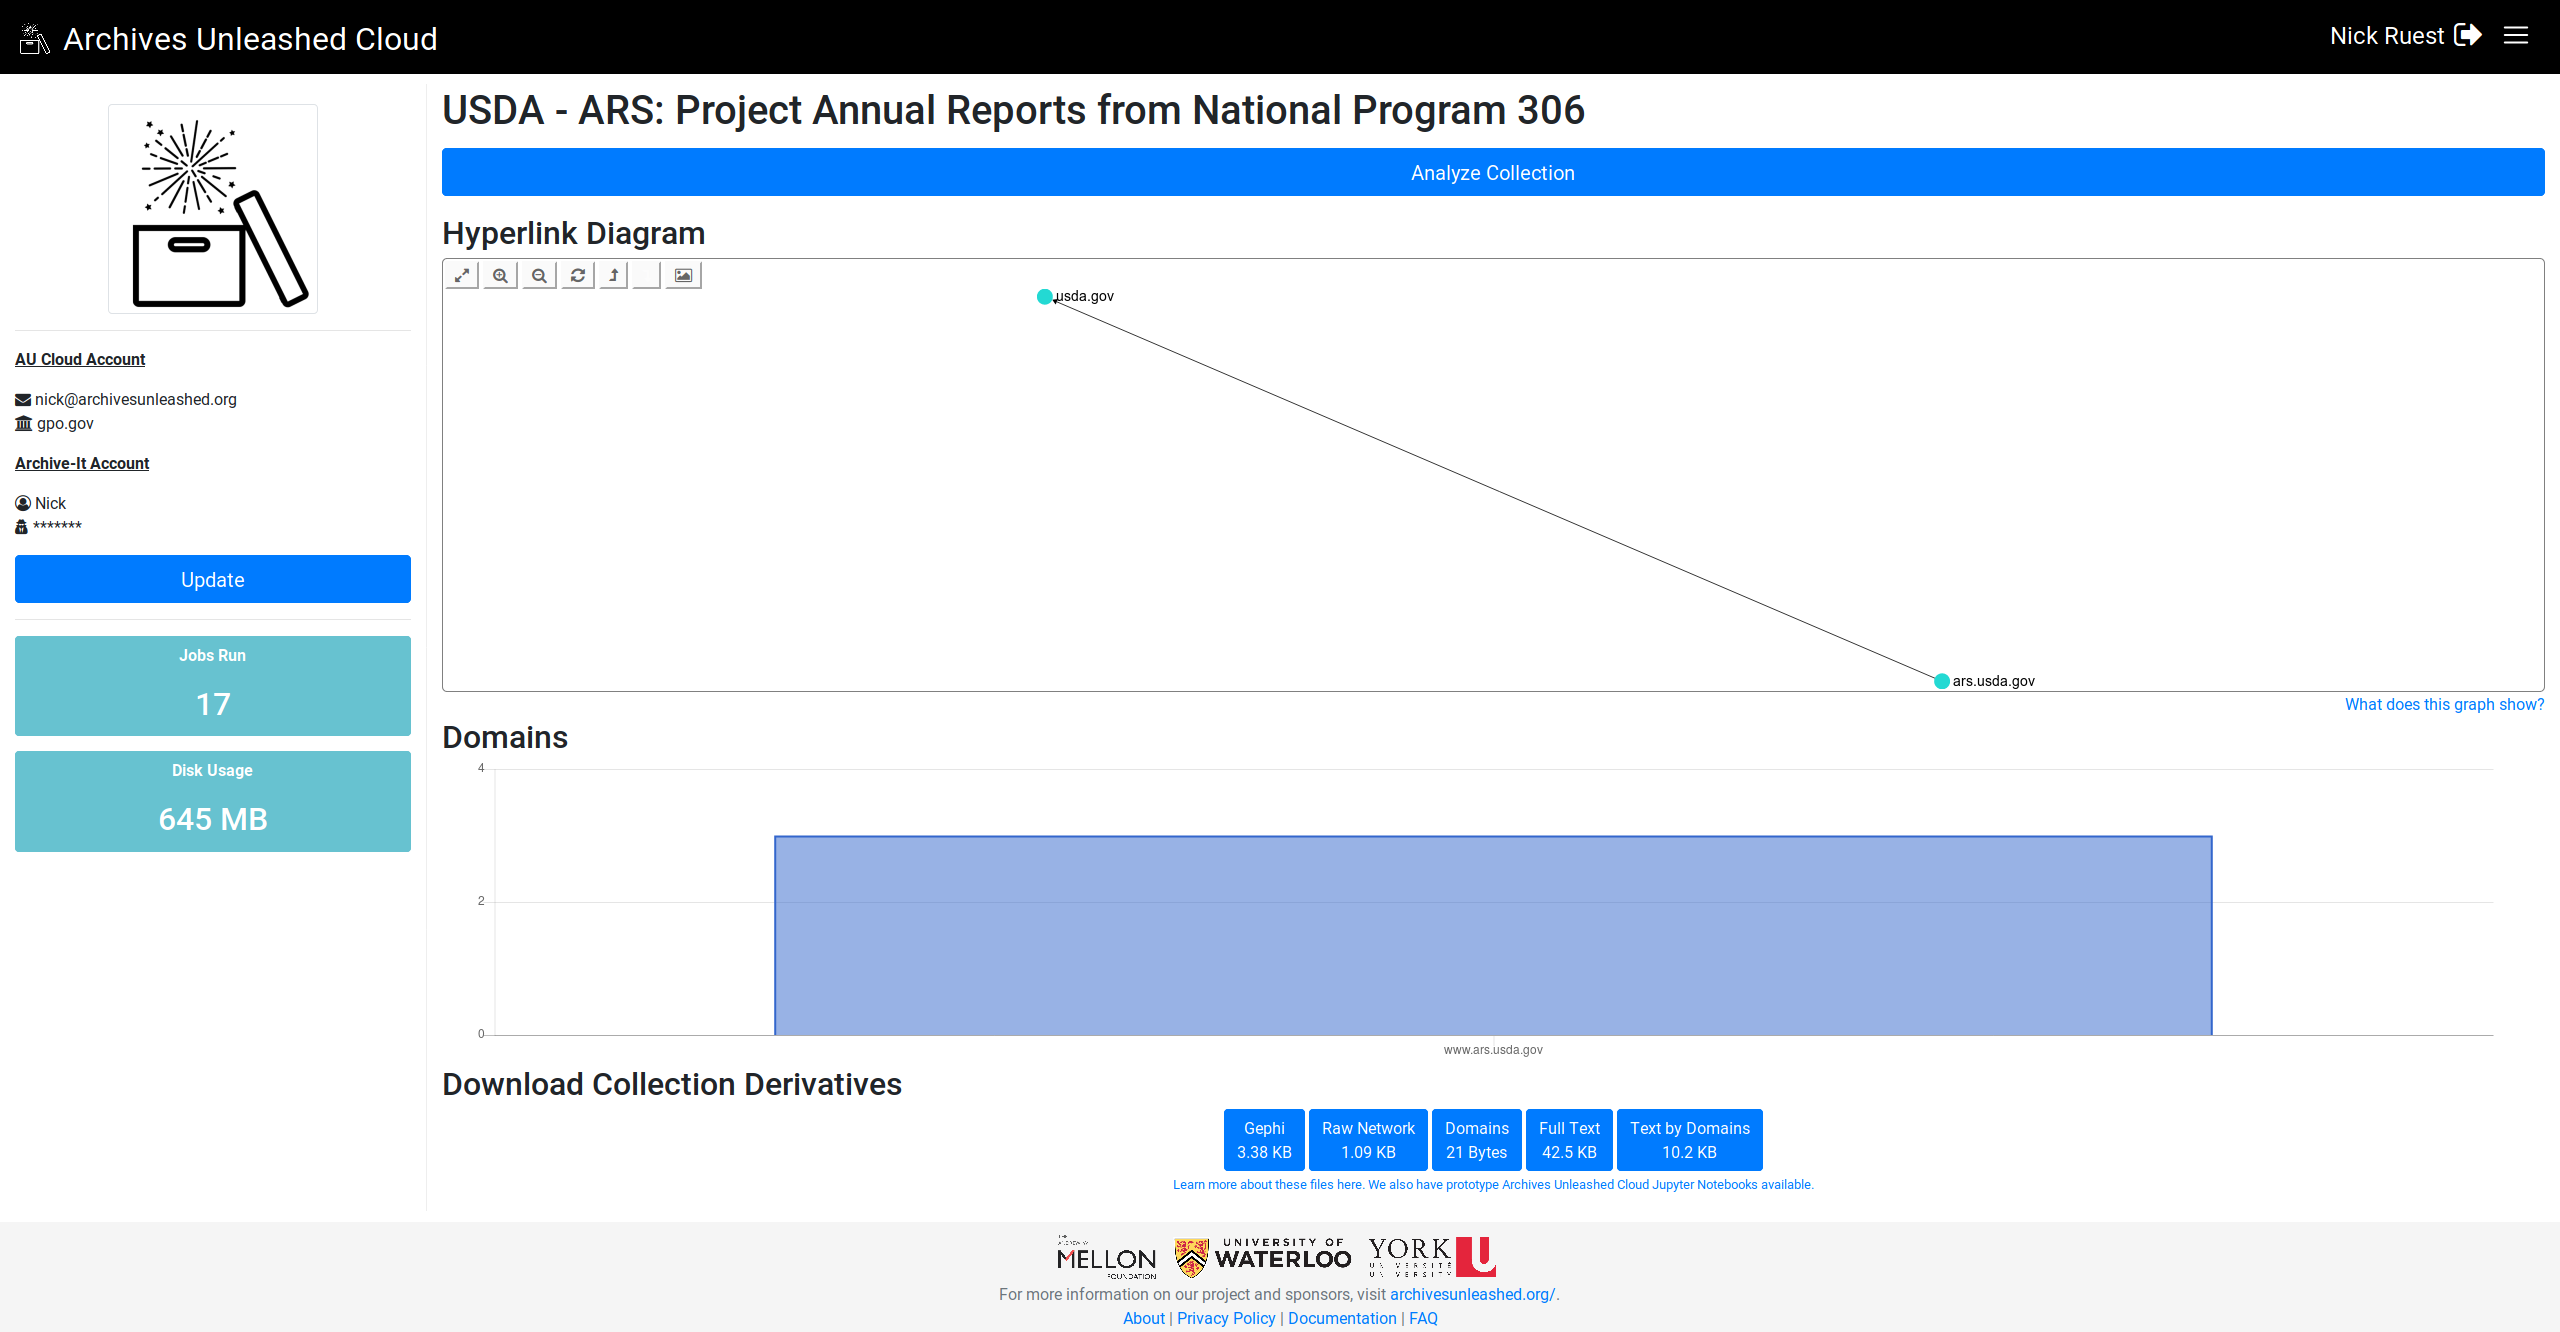
Looking great! Can't wait to see this rolled out!

Is something funky happening with the labels – the columns don't always have labels, maybe when there are too many of them? And in the FCSIC screenshot above, the most frequent domains are in the middle of the graph as opposed to at the left. In general, they seem to be declining frequency left -> right?

@SamFritz

This comment has been minimized.

Copy link
Member

commented May 2, 2019

This looks great @ruebot! :)

The only thing noticeable was described by @ianmilligan1 ^^

@ruebot

This comment has been minimized.

Copy link
Member Author

commented May 2, 2019

Cool. I'll work on sorting them, and see if I can get the label to display for all of them.

@ruebot

This comment has been minimized.

Copy link
Member Author

commented May 2, 2019

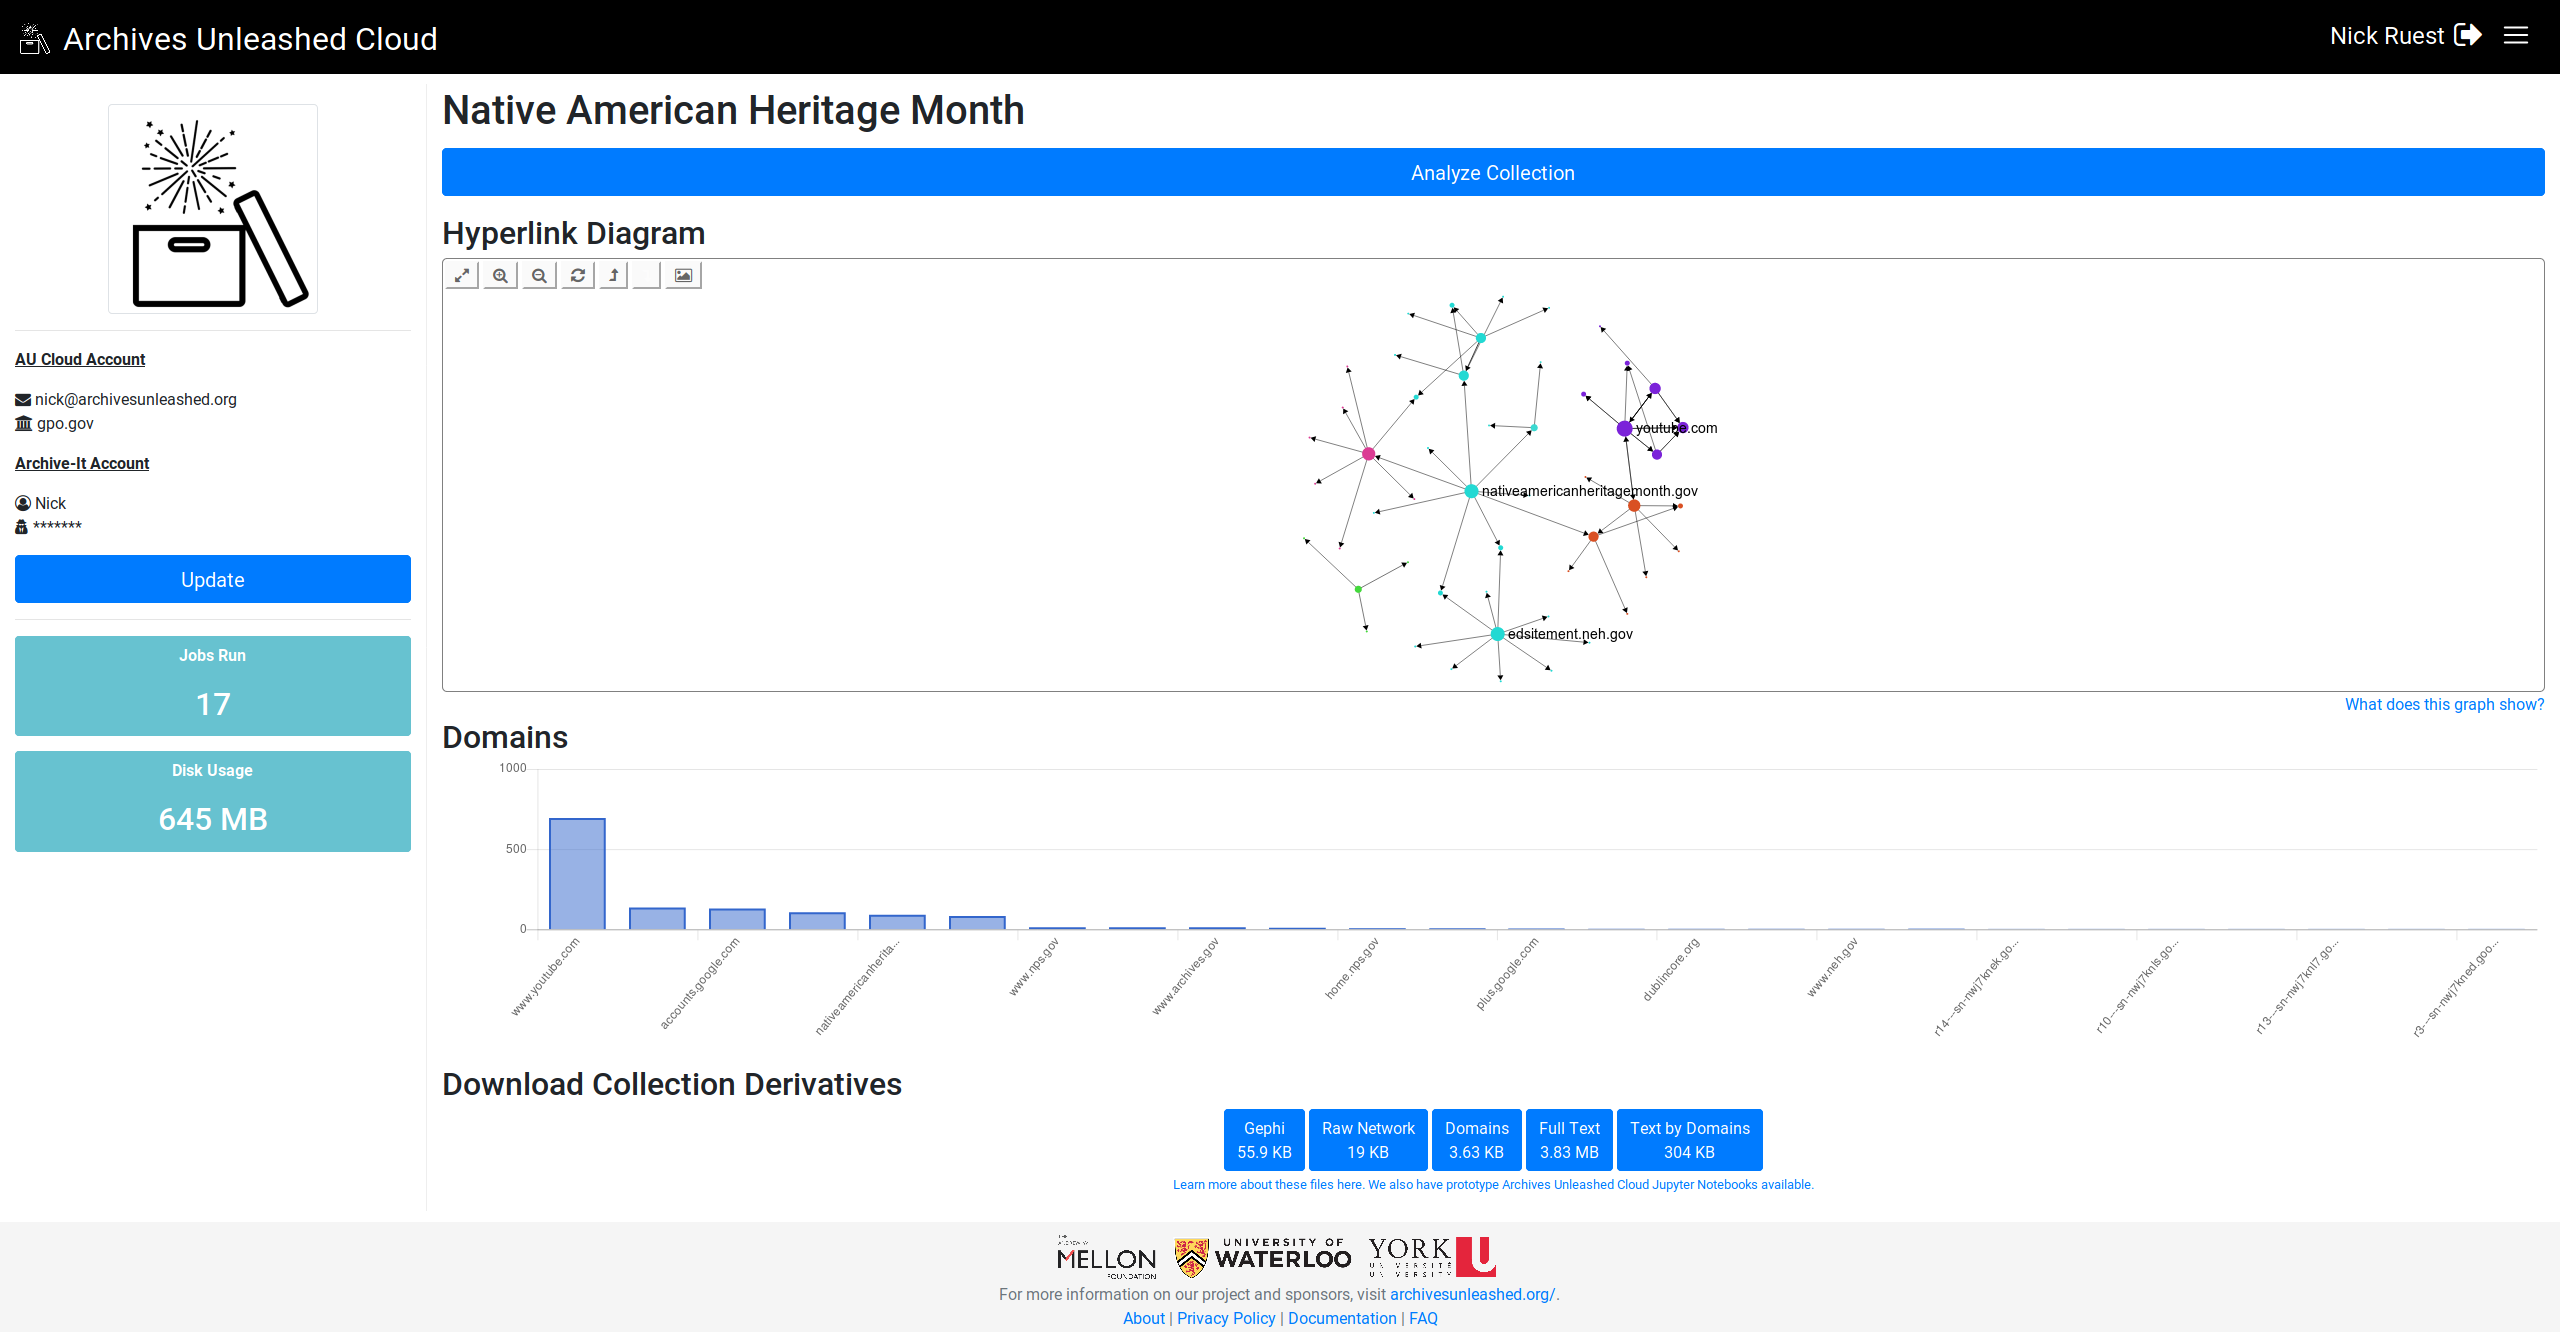
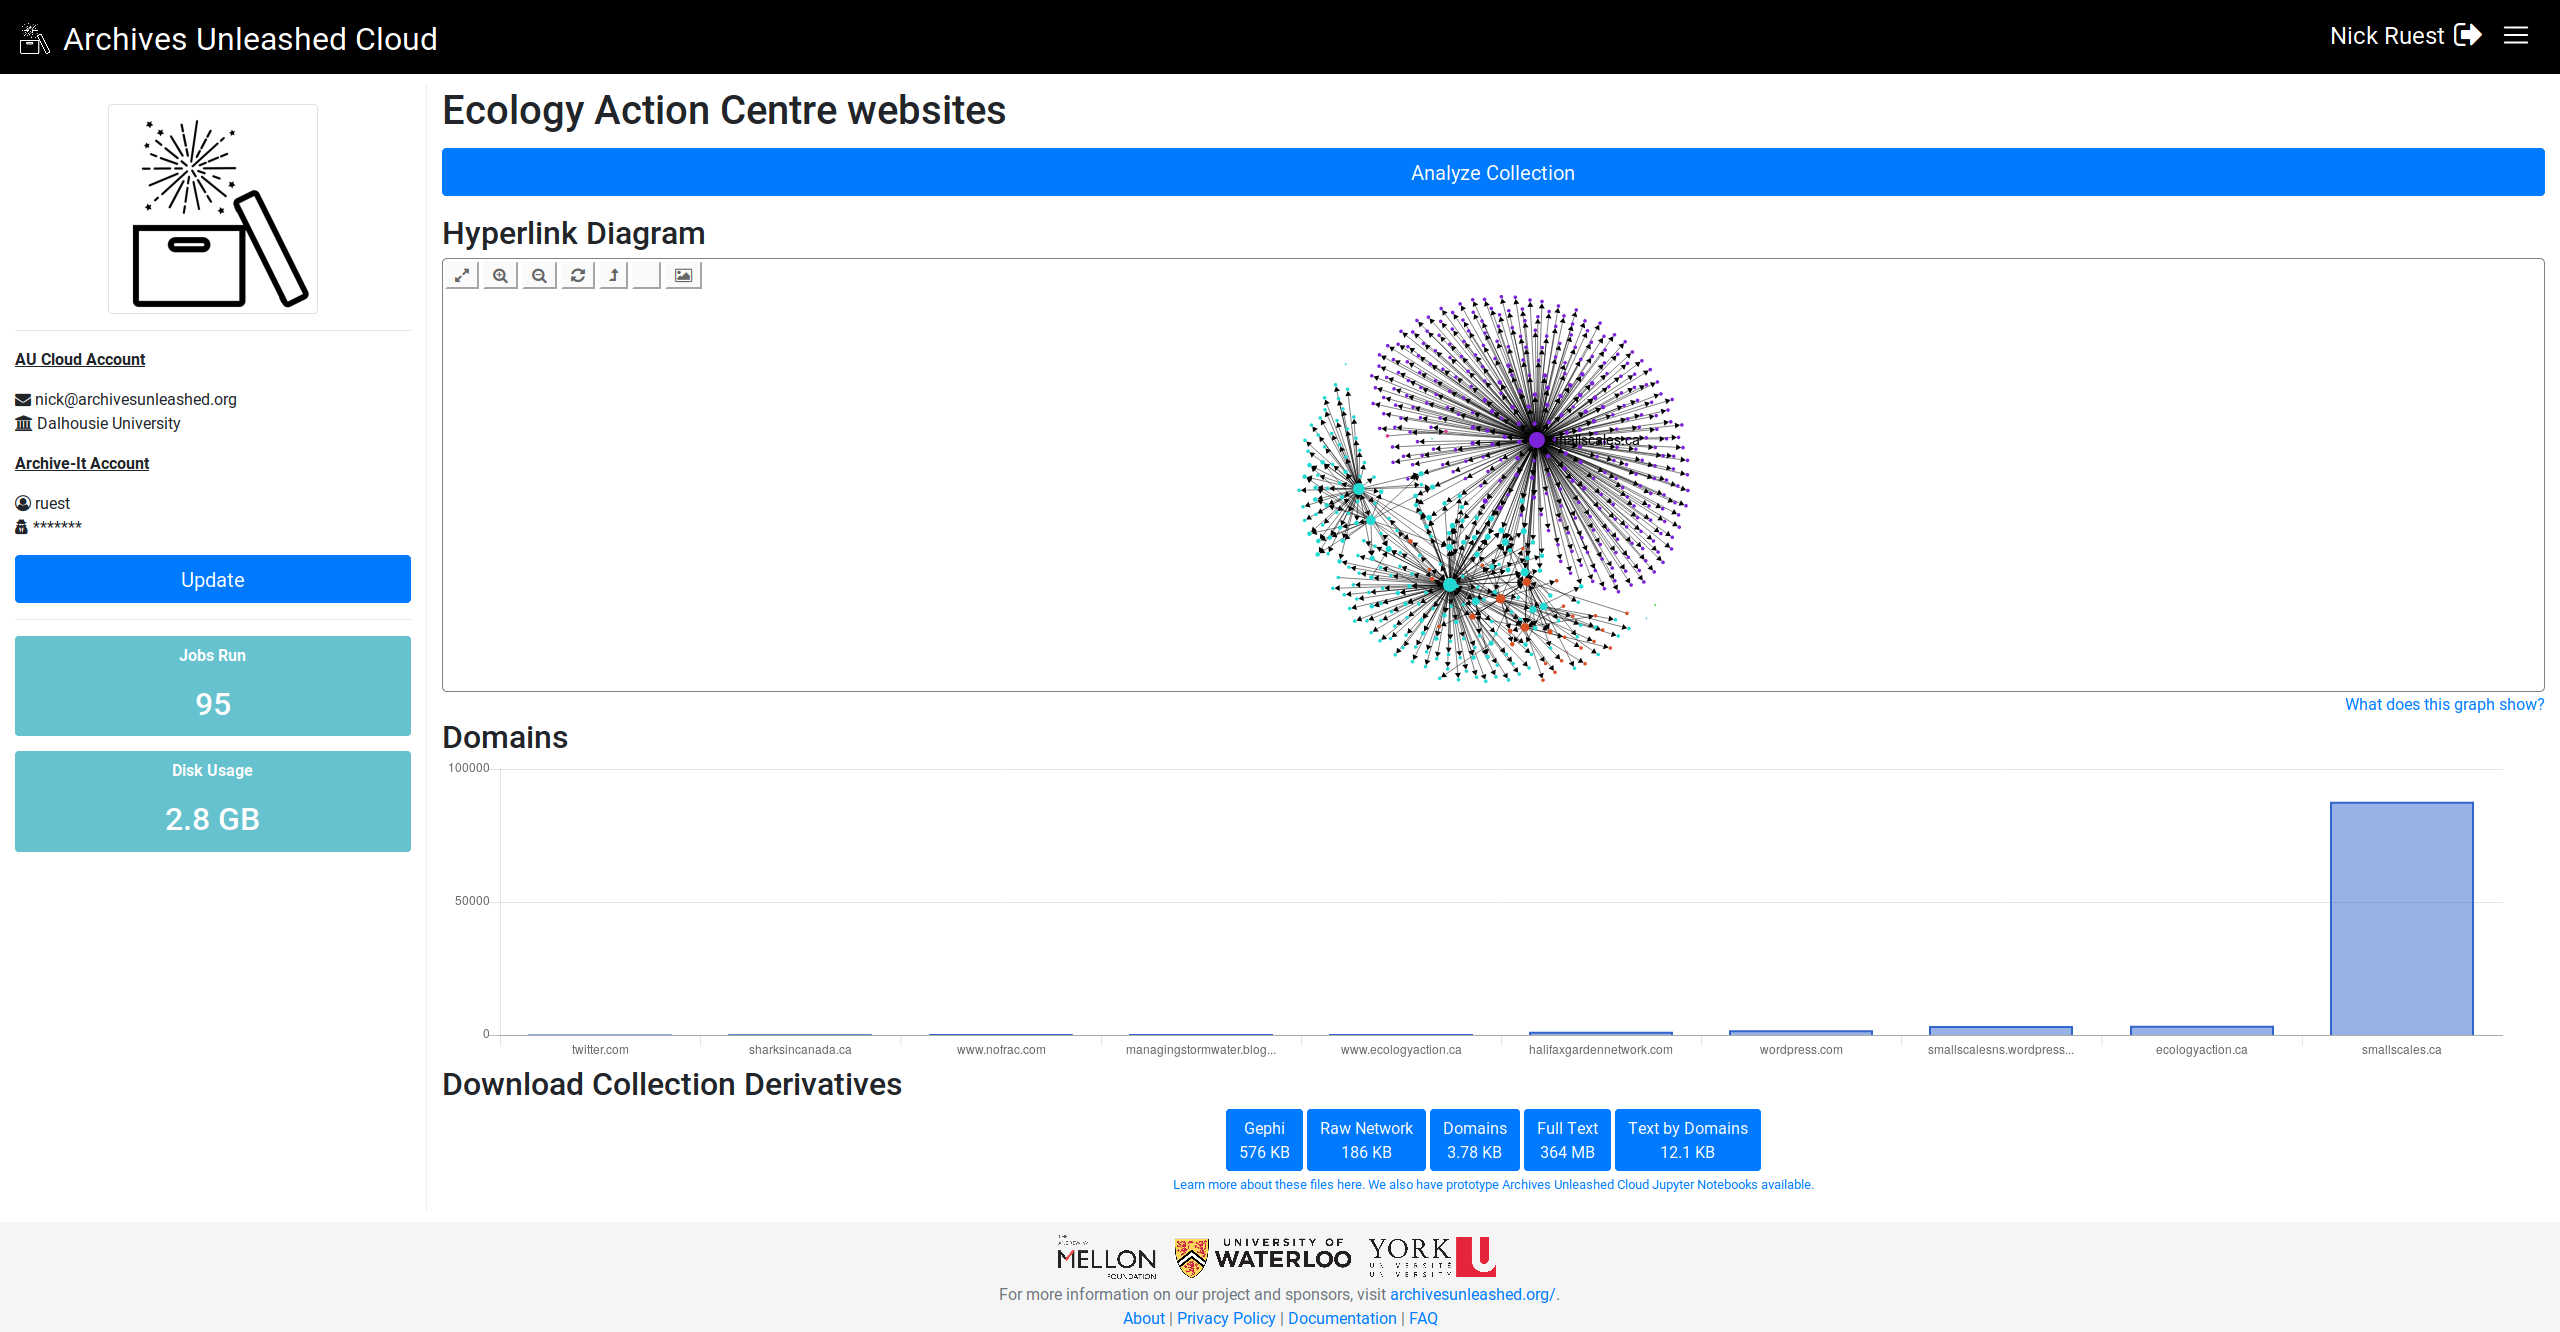
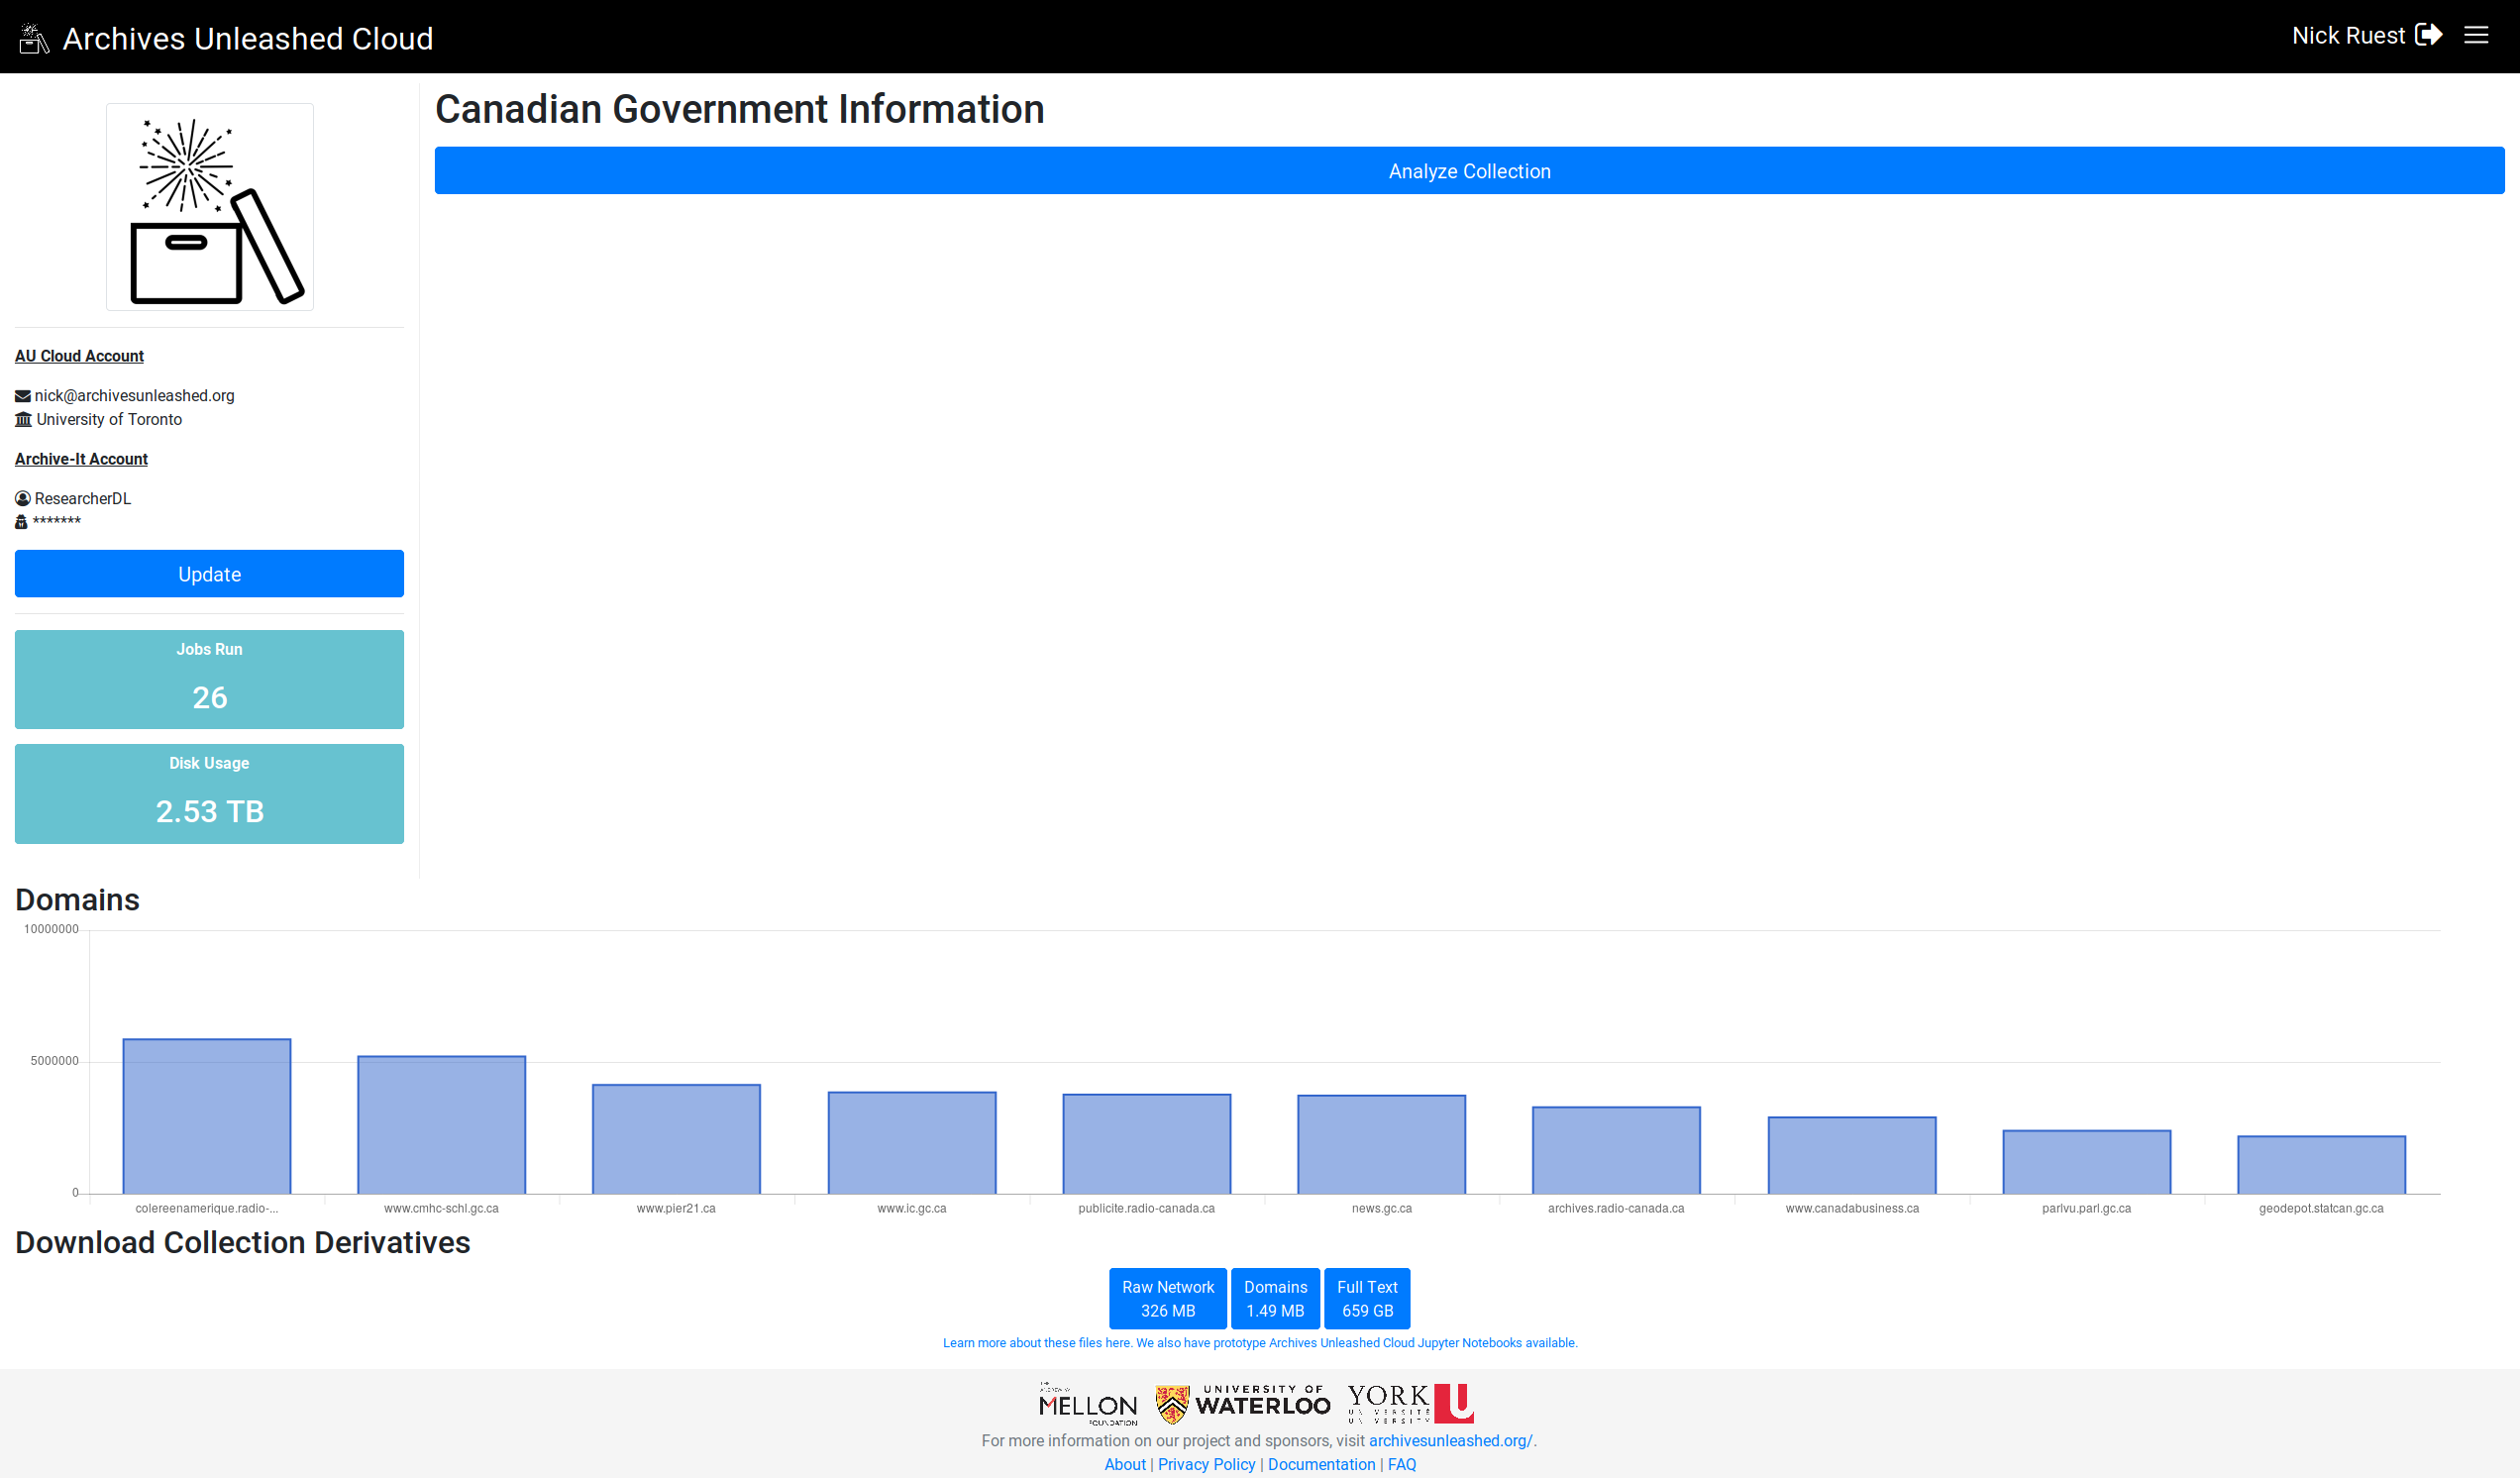
Here we go. Let me know what you think (especially, do you want largest on left or right?)

Screenshot_2019-05-02 Ecology Action Centre websites Archives Unleashed
Screenshot_2019-05-02 Federal Interagency Forum on Child and Family Statistics Archives Unleashed
Screenshot_2019-05-02 OceanNOMADS Archives Unleashed
Screenshot_2019-05-02 Commission to Eliminate Child Abuse and Neglect Fatalities Archives Unleashed(1)
Screenshot_2019-05-02 Our Documents Archives Unleashed(1)
Screenshot_2019-05-02 FCSIC, Farm Credit System Insurance Corporation Archives Unleashed(1)

@ianmilligan1

This comment has been minimized.

Copy link
Member

commented May 2, 2019

Looking great! I would probably prefer the larger on left if possible?

@SamFritz

This comment has been minimized.

Copy link
Member

commented May 2, 2019

Nice! Since we read left to right, I think it would make sense to read the chart big (left) to small (right)

ruebot added a commit that referenced this issue May 2, 2019

Remove domains table, and replace with chart; address #146.
- Update display_domains helper for chart data
- Create controller methods for domains chart data feed
- Add route for feed
- Update Rubocop config
@ruebot

This comment has been minimized.

Copy link
Member Author

commented May 2, 2019

Updated production. Poke around and let me know what you think.

@ianmilligan1

This comment has been minimized.

Copy link
Member

commented May 2, 2019

Looks great to me! 🎉

Screen Shot 2019-05-02 at 5 23 29 PM

Close issue for the time being or keep open?

@ruebot

This comment has been minimized.

Copy link
Member Author

commented May 2, 2019

We gotta sort out the other bit with the additional Spark job, then we can close it.

@ruebot

This comment has been minimized.

Copy link
Member Author

commented May 2, 2019

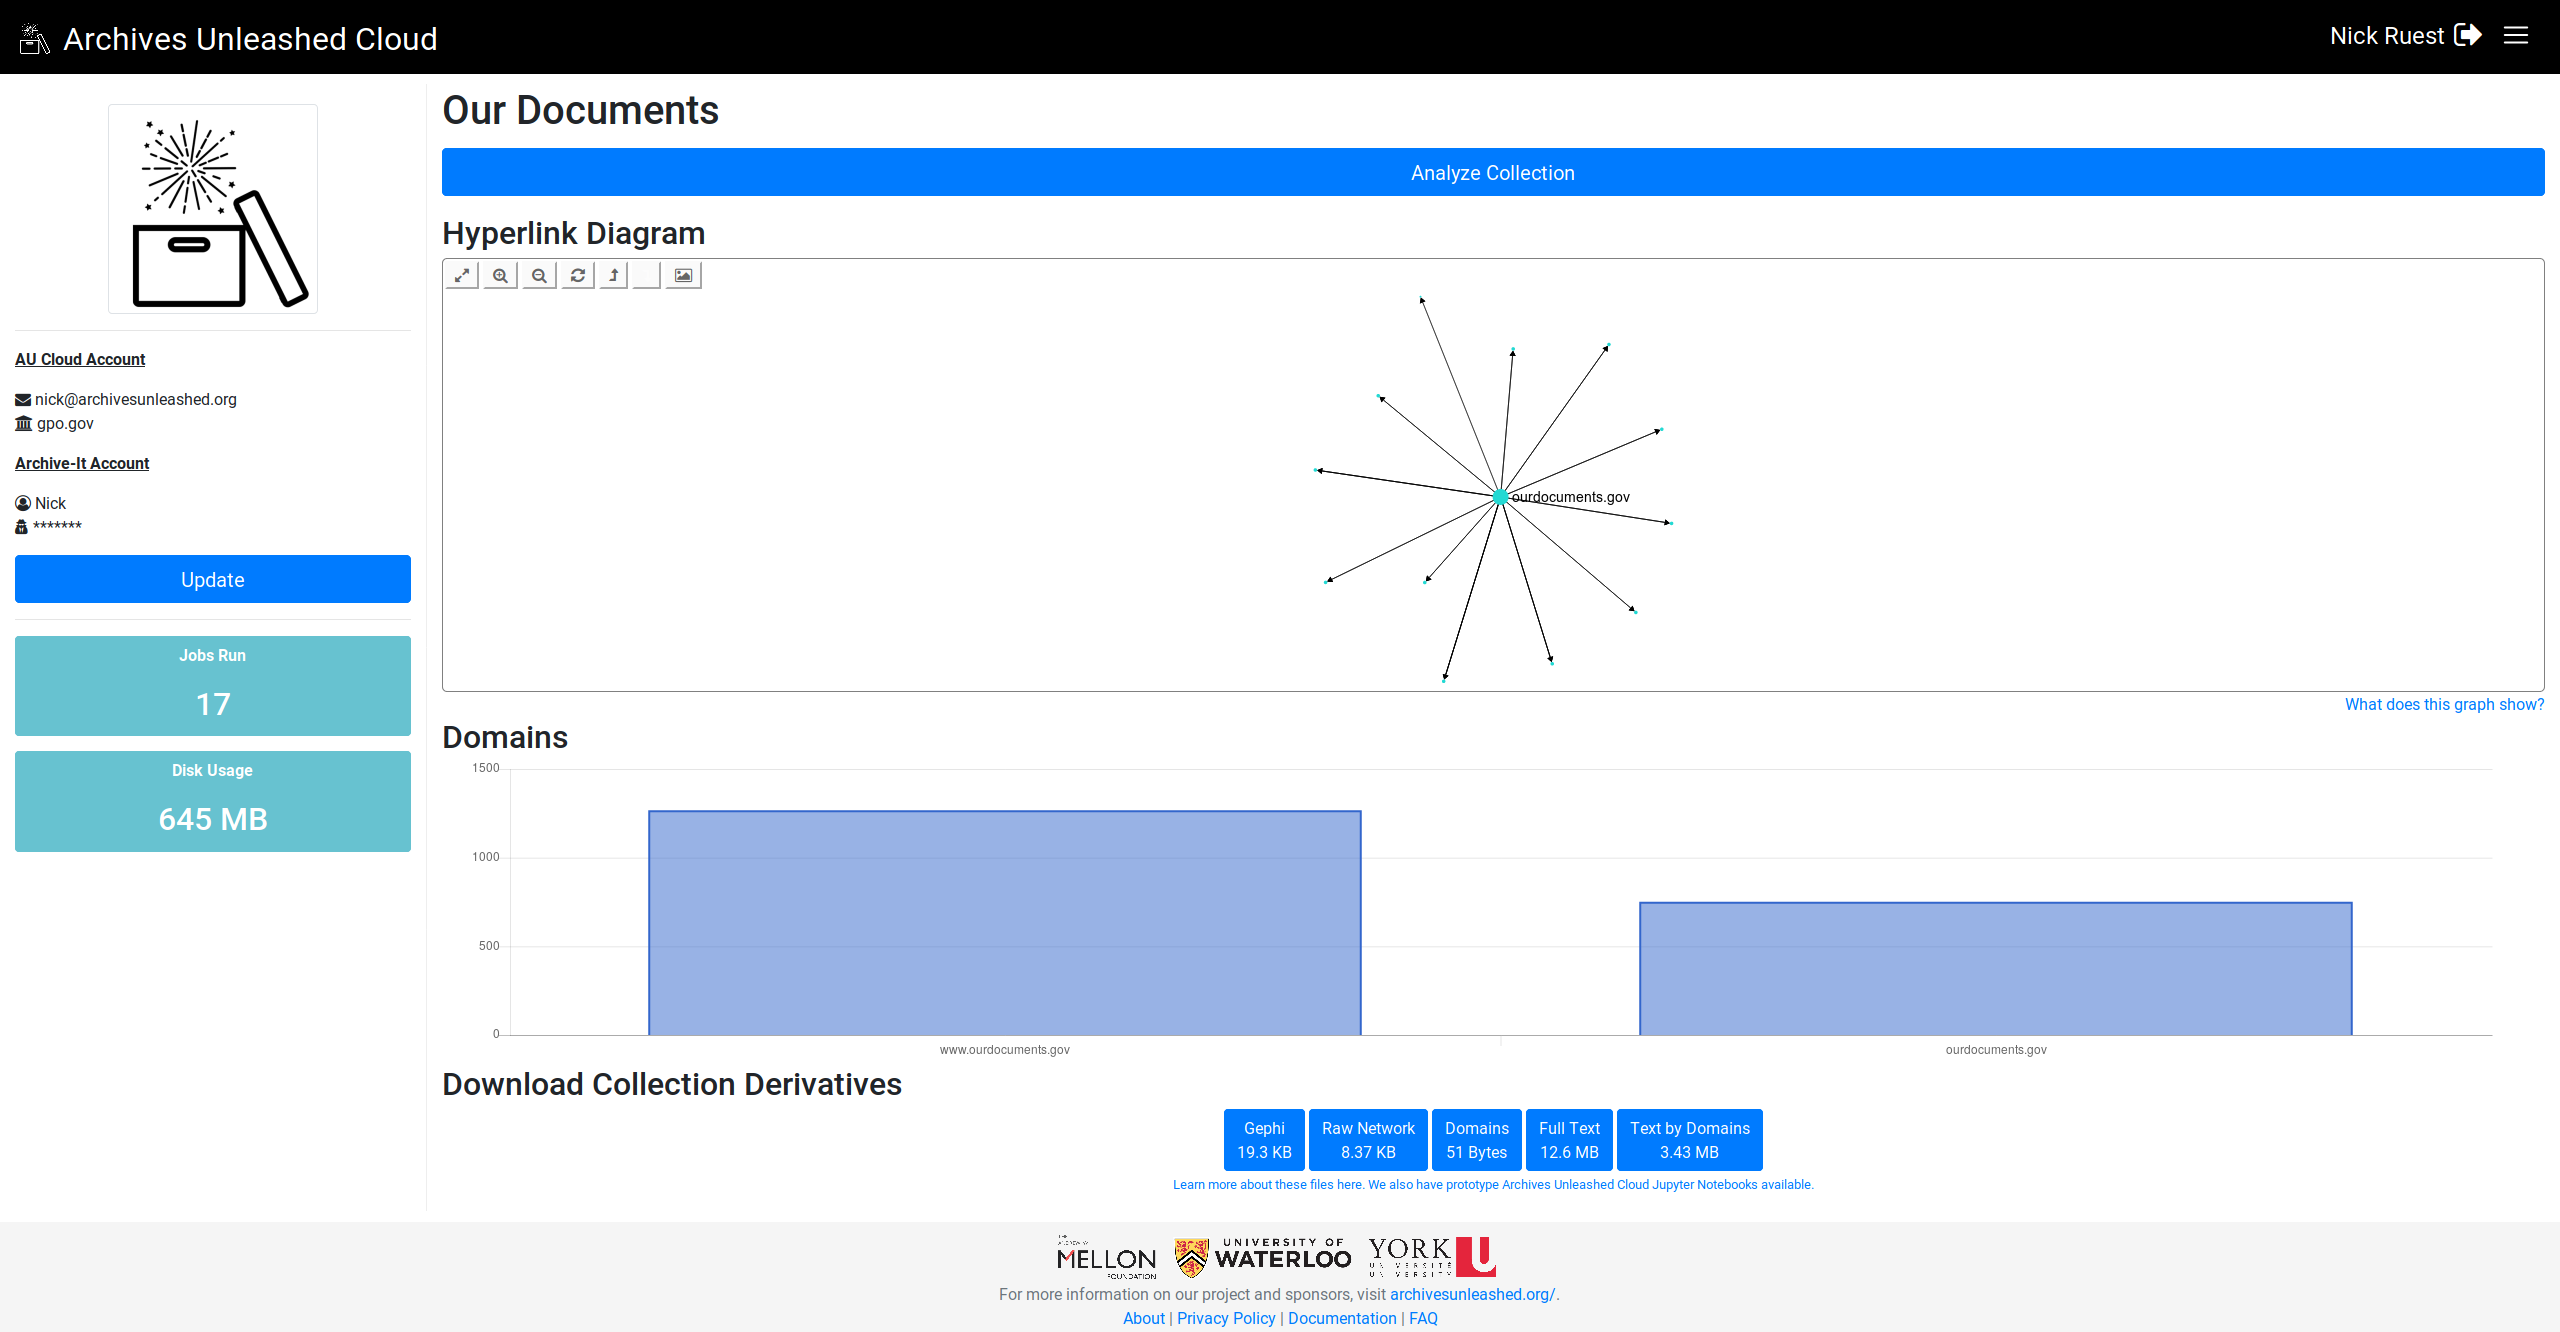
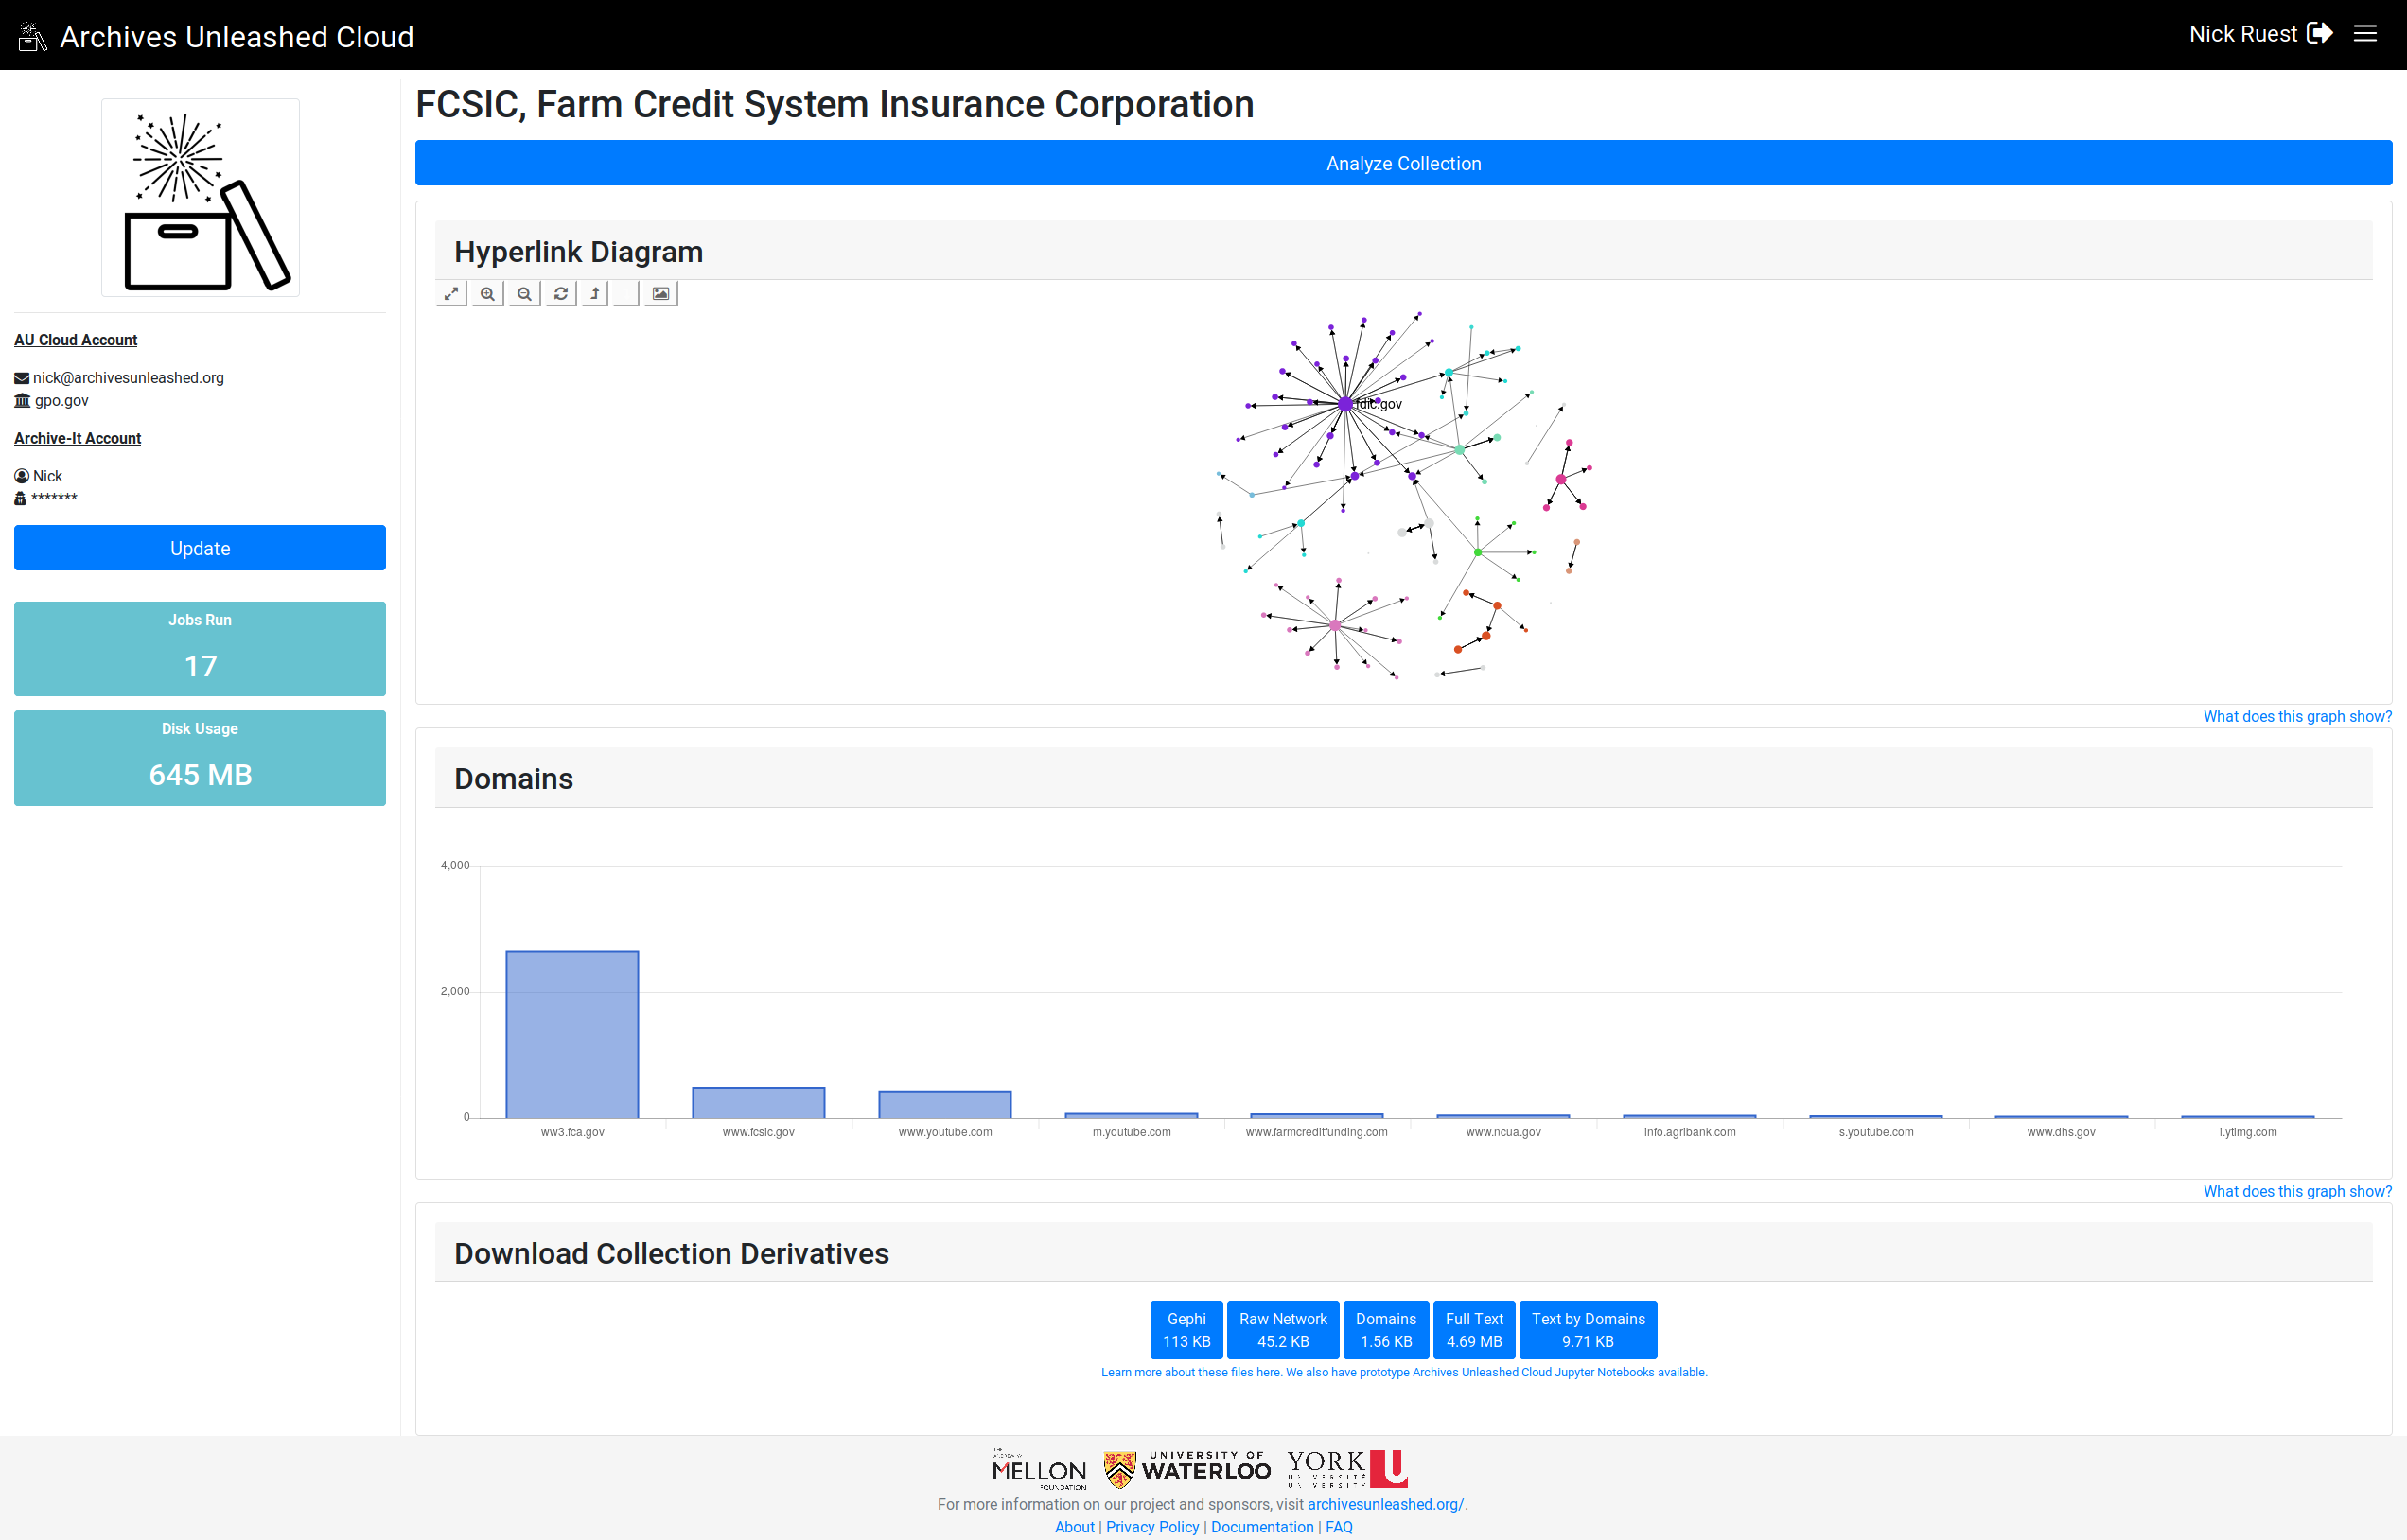
Gotta fix this formatting issue on the big collections where GraphPass won't run:

Screenshot_2019-05-02 Government Information Collection Archives Unleashed
Screenshot_2019-05-02 Canadian Government Information Archives Unleashed

@ianmilligan1

This comment has been minimized.

Copy link
Member

commented May 3, 2019

We gotta sort out the other bit with the additional Spark job, then we can close it.

Sounds good - as discussed in Slack, I think, let’s chat about that on our next team call! And good catch on that formatting issue

@ruebot

This comment has been minimized.

Copy link
Member Author

commented May 3, 2019

Fixed. Added a "What does this graph show?" under the bar chart. The tooltip reads: "This diagram
visualizes the top 10 domains that occur in the web archive collection."

Let me know if that text should change.

Screenshot_2019-05-03 Our Documents Archives Unleashed
Screenshot_2019-05-03 FCSIC, Farm Credit System Insurance Corporation Archives Unleashed(1)

@ianmilligan1

This comment has been minimized.

Copy link
Member

commented May 3, 2019

Good call on the "What does this graph show?" – text looks perfect to me, @ruebot !

ruebot added a commit that referenced this issue May 3, 2019

Sign up for free to join this conversation on GitHub. Already have an account? Sign in to comment
You can’t perform that action at this time.